Chapter 3 Results
3.1 Pilot study QC
In order to assess the reliability of the EM-seq kit, a pilot study was performed as outlined in section 2.2. To assess the performance of the EM-seq kit, we performed multiple quality control analyses. We first extracted the average CpG methylation from specific contigs as well as the spike-in controls for use in a quality control assessment analysis. These included chromosome 1, the mitochondrial chromosome, lambda phage and pUC19 plasmid.
3.1.1 Percentage CpG methylation
We expect the chromosome 1 CpG sites to be intermediately methylated. As a comparative species, zebrafish chromosomal CpG methylation is ~80% (Goll and Halpern 2011) and we therefore expect our guppy samples to be relatively close to this. We also expect that the chromosome 1 CpG methylation percentages would not significantly differ between each of the samples as these experimental light conditions are unlikely to alter total methylation percentages significantly. The chromosome 1 CpG methylation percentage (Figure 3.A) ranged from 65% and 69%. This is relatively low variation between the samples and close to the zebrafish’s ~80% chromosomal CpG methylation.
The pUC19 was included in this pilot study as the positive control. The plasmid was supplied fully methylated at the CpG sites and we therefore expect its CpG methylation to be very high (>95%). We expect the pUC19 plasmid and lambda phage DNA methylation to not differ significantly between the samples as the same quantity and source of lambda phage and plasmid DNA were spiked into each of them. The pUC19 plasmid CpG methylation percentage (Figure 3.B) for each of our samples was >95% and there was low variation among the samples (~3%).
Lambda phage was included in this pilot study as the negative control and therefore we would expect CpG methylation here to be very low (<5%). The lambda phage DNA CpG methylation percentage (Figure 3.C) for each of our samples was significantly <5%. The variability among the samples for this metric was also low (~0.6%).
We expect low CpG methylation (<5%) on the mitochondrial chromosome as we know that very little to no methylation exists here. As essentially 0% methylation exists at this site we expect very little variation between samples. The CpG methylation within the Mitochondrial chromosome was very low (<1%) and there was minimal variation among the samples (~0.4%) (Figure 3.D).
Within the chromosomal, lambda phage and mitochondrial chromosome (Figure A, C and D) the T11-F-N sample had greater (Lambda phage and mtDNA) or lower (chromosomal) percentage of CpG methylation than the other samples. This may suggest a minor problem with the sample quality and/or the profiling of it. However, overall the results found in each of these quality control metrics provide evidence of the high quality methylation data generated with the NEBnext enzymatic methyl-seq kit.
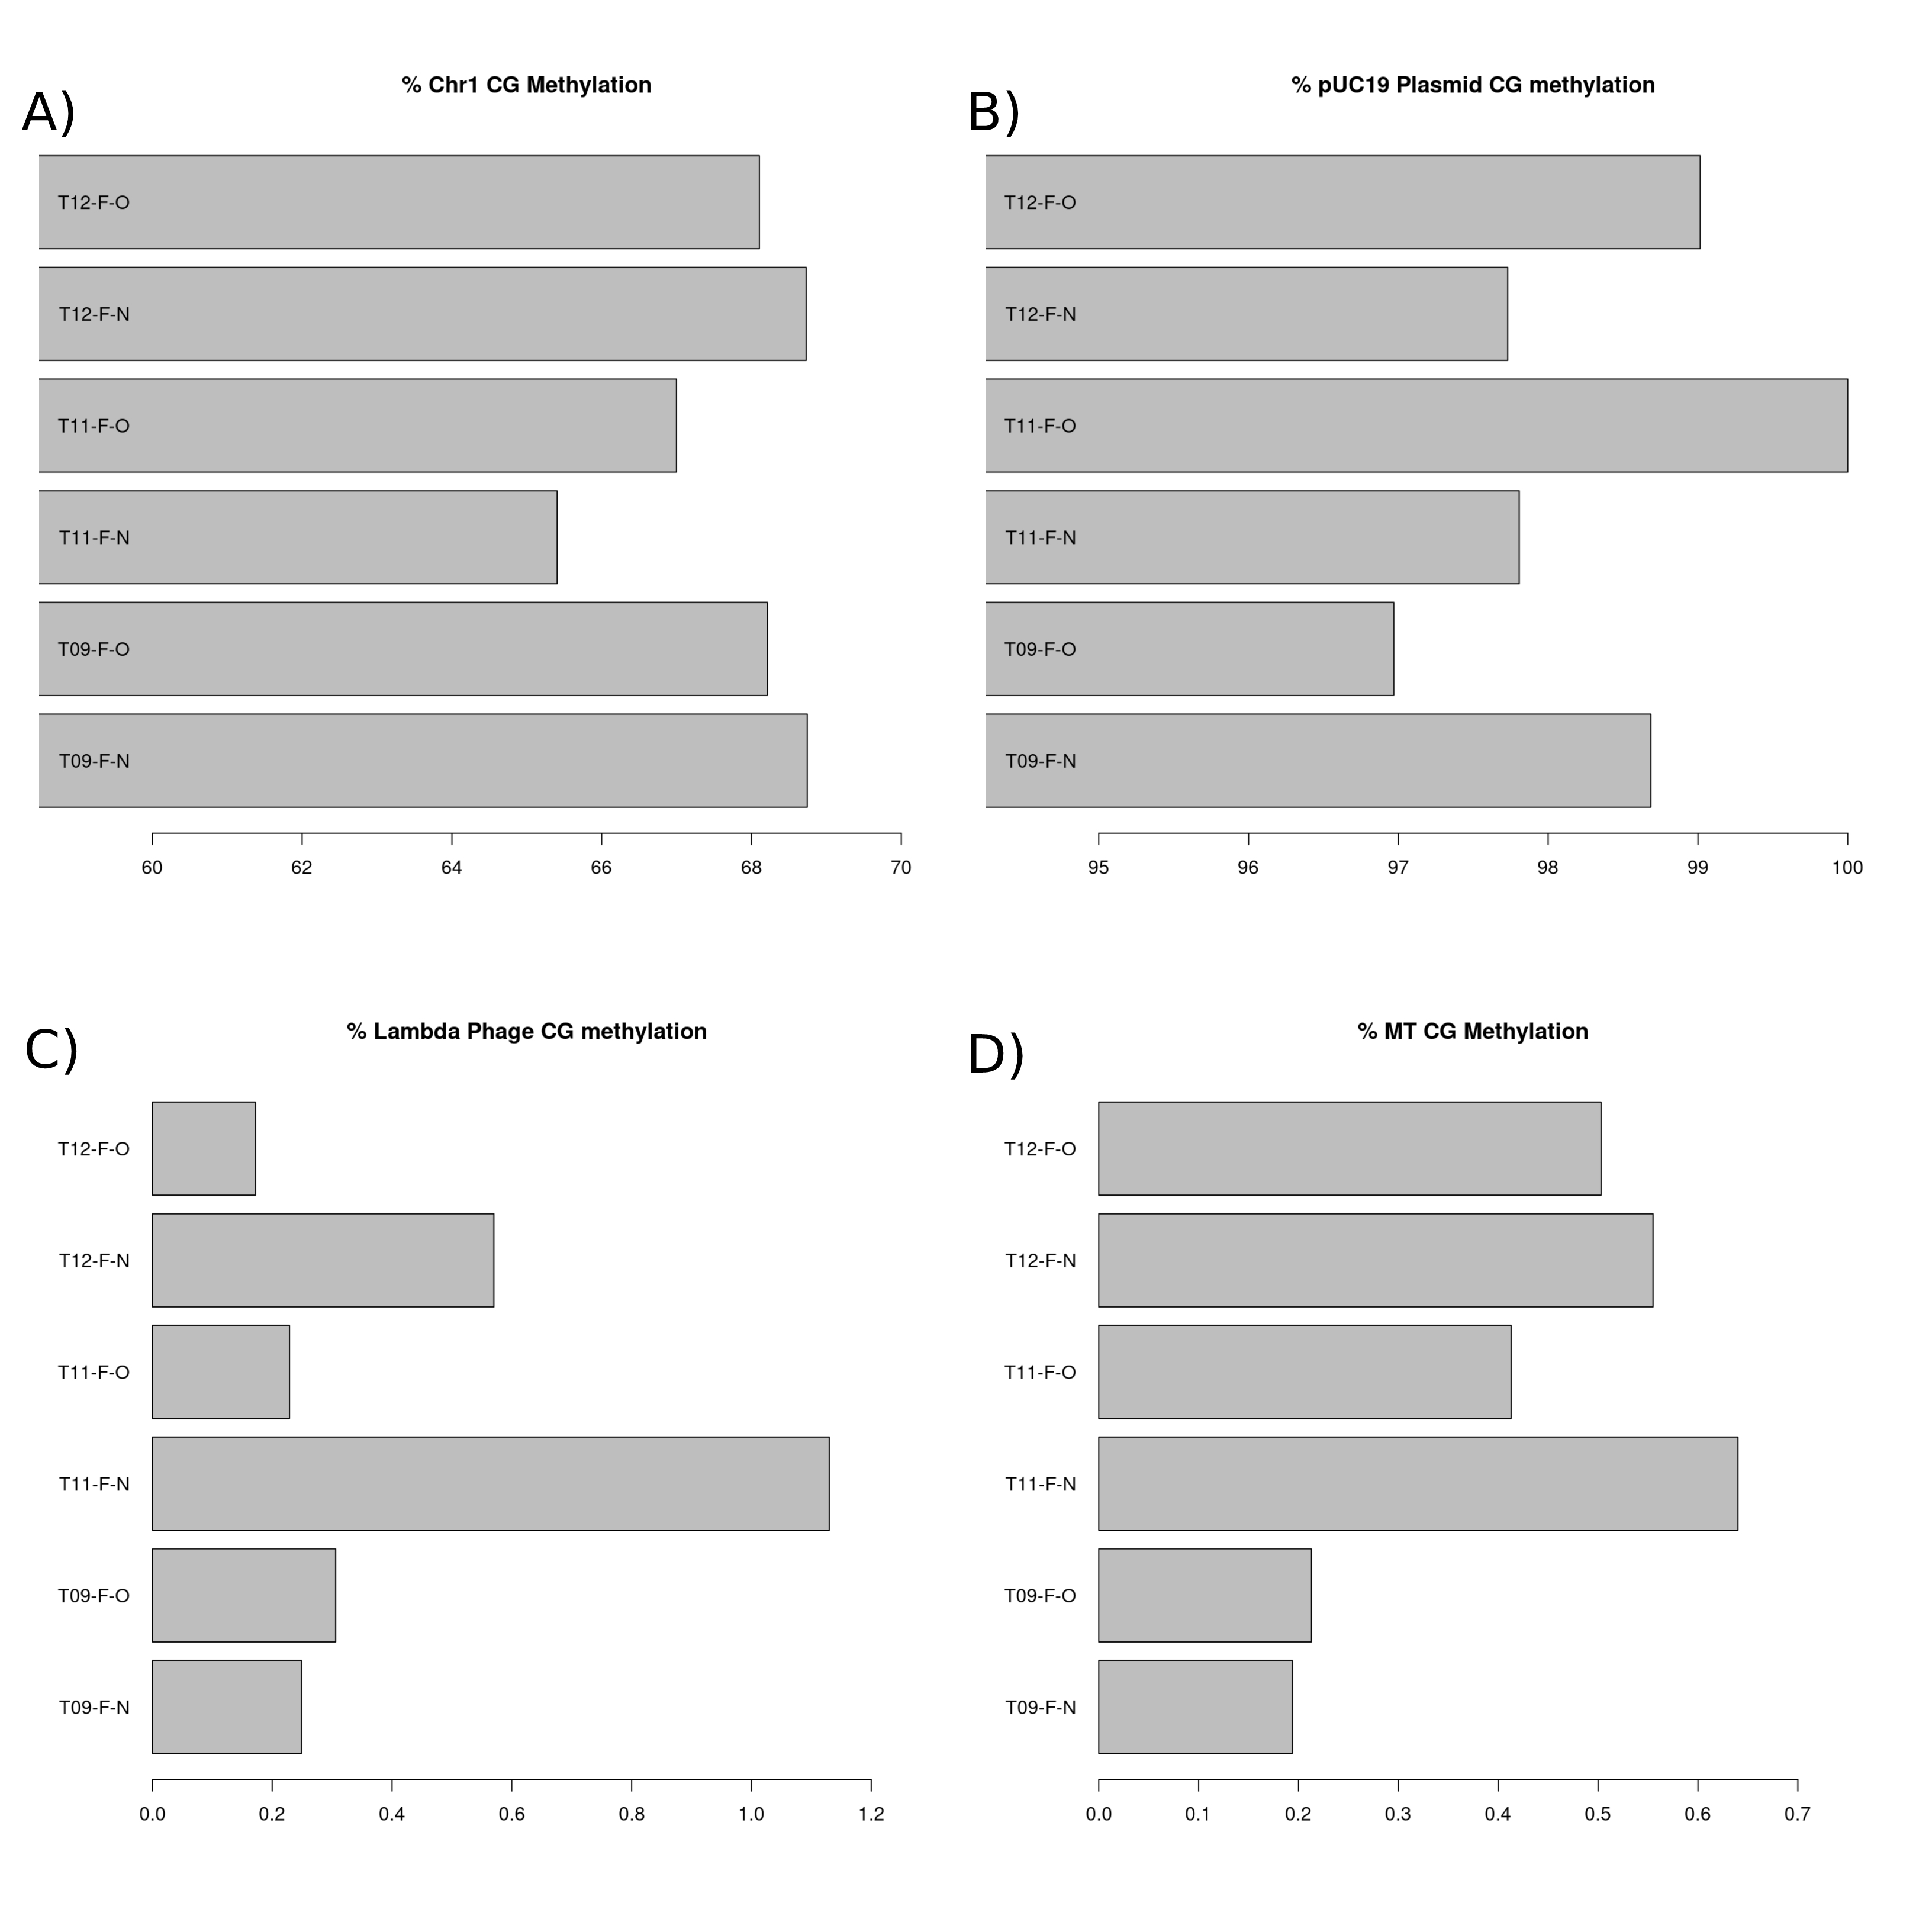
Figure 3.1: CpG methylation percentage present in each sample of the pilot study. (A) Bar chart displaying the CpG methylation present in chromosome 1 of each sample. (B) Bar chart displaying the CpG methylation present in the spiked in pUC19 plasmid DNA in each of the samples. (C) Bar chart displaying the CpG methylation present in the spiked in lambda phage DNA in each of the samples. (D) Bar chart displaying the CpG methylation present in the mitochondrial chromosome in each of the samples.
3.1.2 Insert length
Suzuki et al. (2018) state that when performing whole genome bisulfite sequencing using NovaSeq, they expect insert lengths to be on average <210 bp in size. In 150-bp paired-end sequencing, a >300 bp insert length is optimal as to be cost and time efficient. For most of our samples, median insert length was ~300 bp (Figure 4), this is an improvement on the expected 210 bp length. The sample T11-F-N results once again deviated from the other samples and had a median insert size of ~210, lower than optimal but meeting our expectation based on the literature.
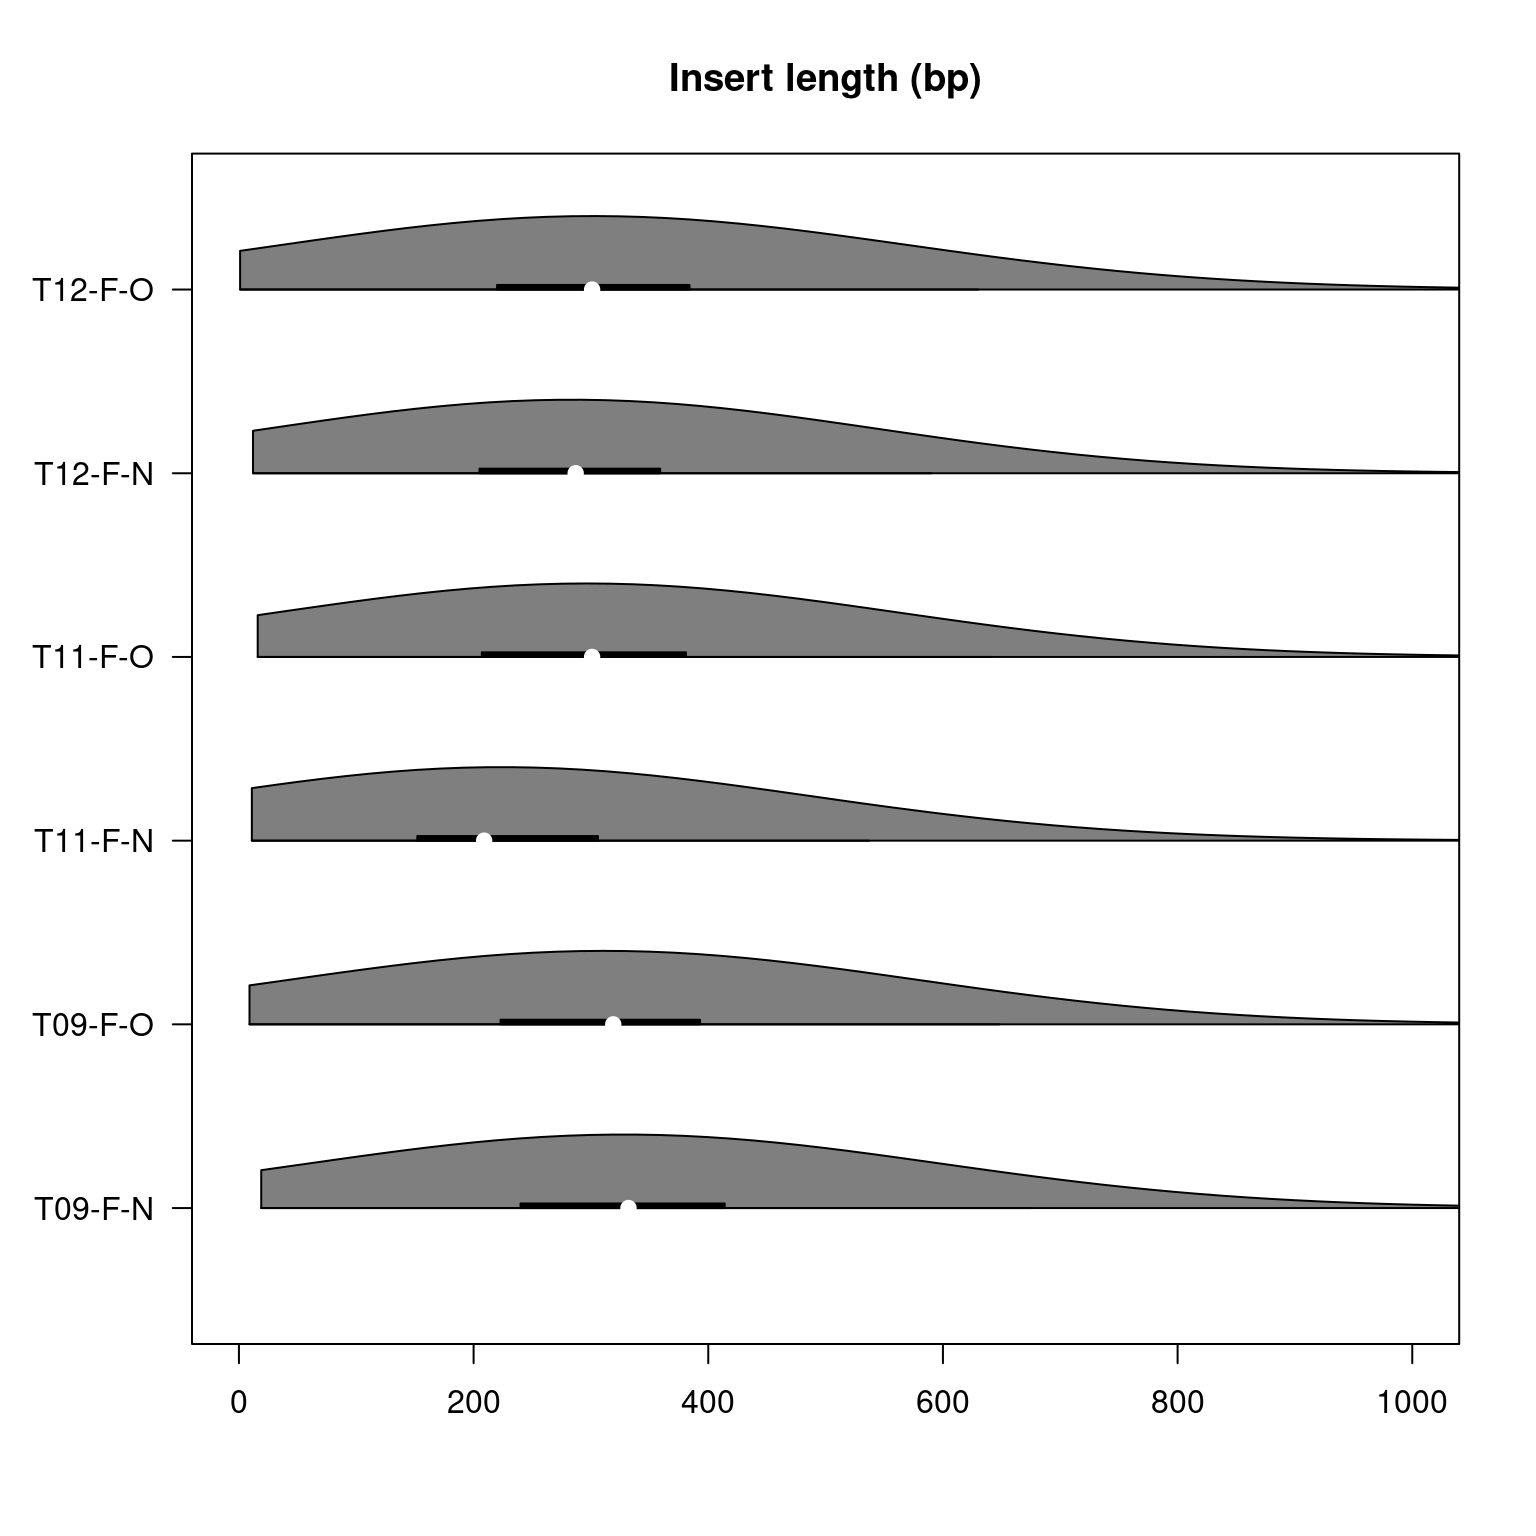
Figure 3.2: Violin plot displaying the insert lengths in base pairs within each sample of the pilot study. The ends of the black line under each violin indicate the interquartile range and the white indentation within the black line indicates the median.
3.1.3 Read length
We expect the average read length to be ~150 bp. This read length derives the most bp coverage from each read while not unnecessarily lowering the quality of the reads. This is therefore the most efficient read length. Most of our samples’ average read lengths (figure 5) were between 147-149 which is close to our optimum length. However, the sample T11-F-N was ~142 bp, less than optimal.
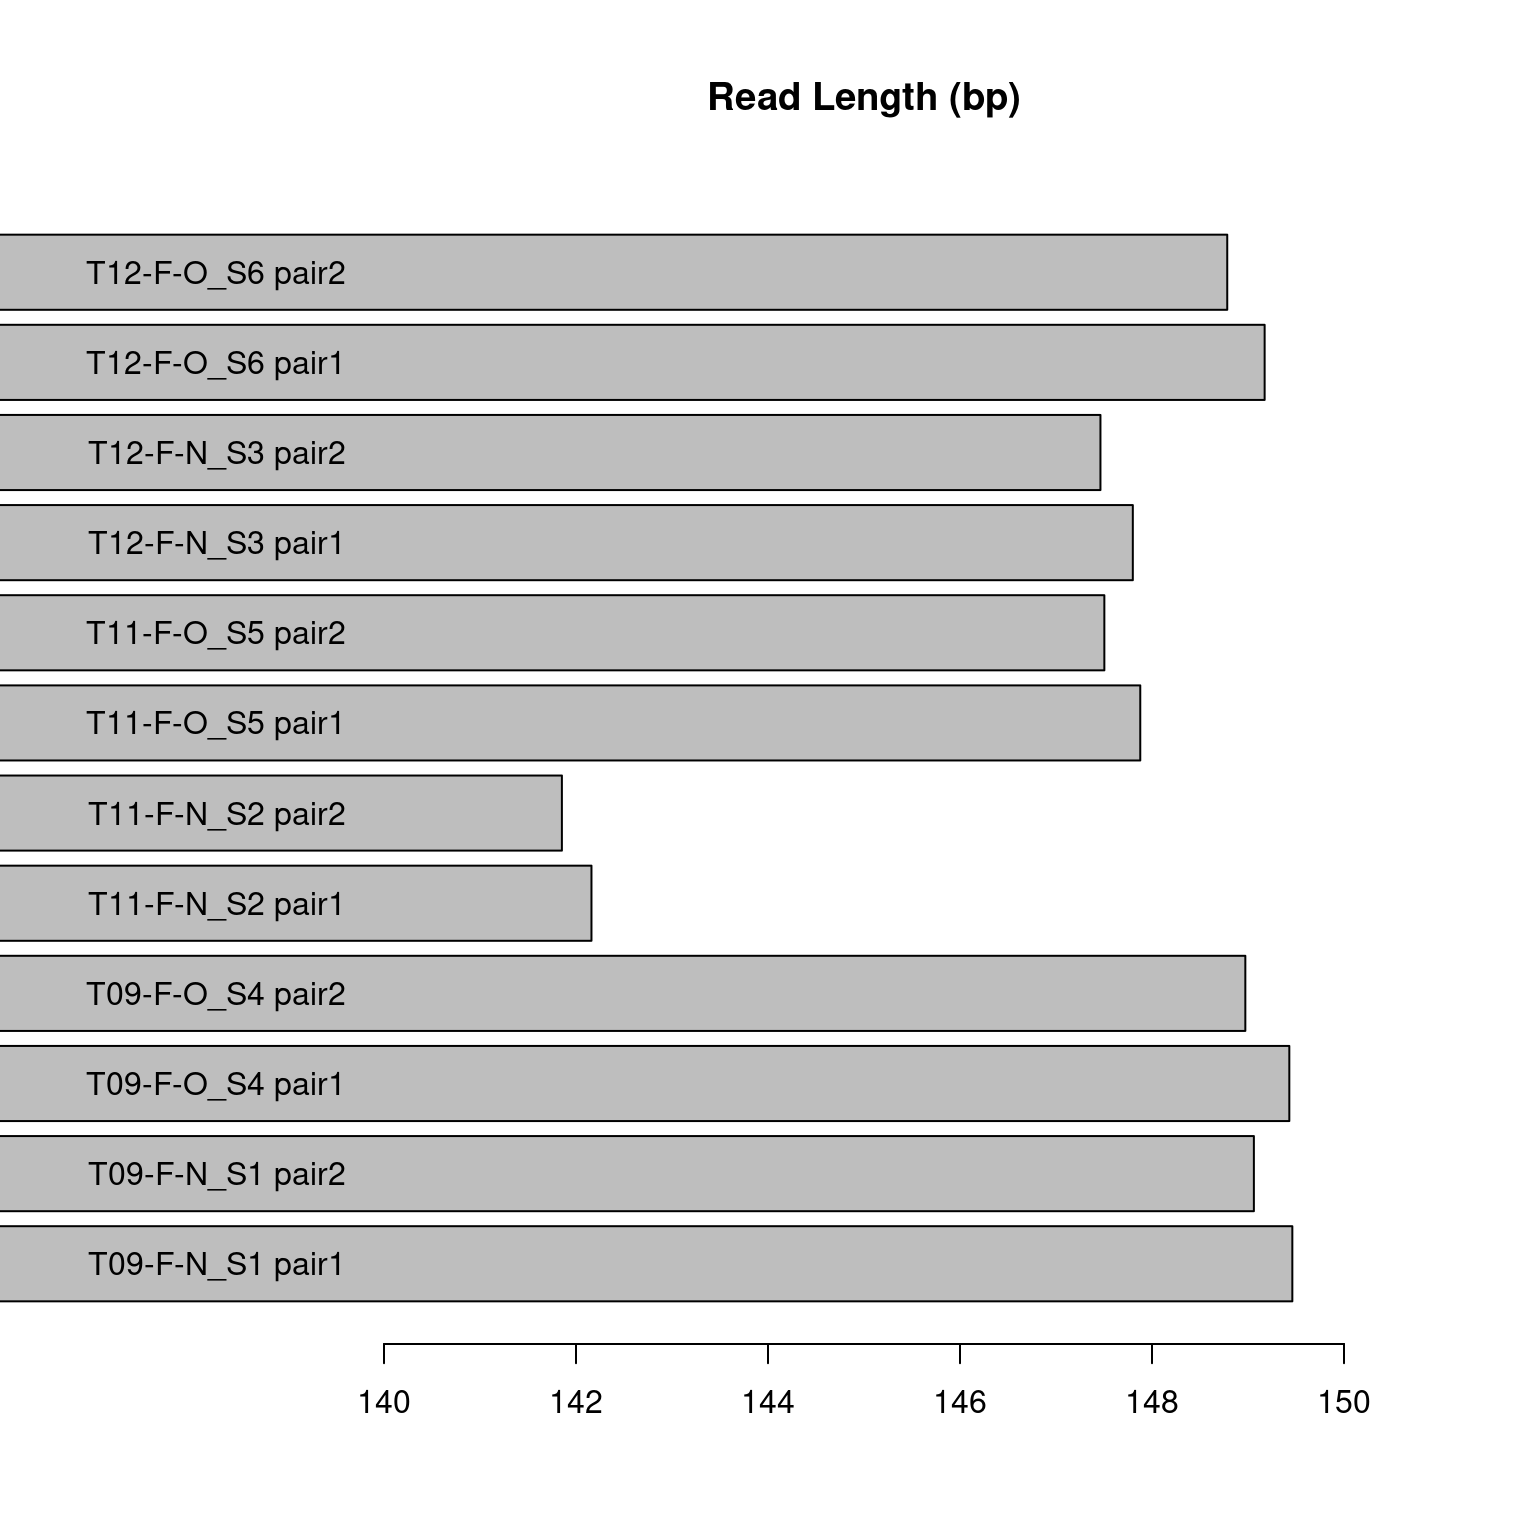
Figure 3.3: Figure displaying the mean read length in base pairs for each sample pair in the pilot study. The samples labeled “pair2” are the forward reads and the samples labeled “pair1” are the reverse reads.
3.1.4 CpH methylation
For our chromosome 1, pUC19 plasmid, lambda phage and mitochondrial chromosome, CpH methylation is expected to be very low (<5%) as CpH sites are methylated at very low percentages. The chromosome 1 CpH methylation (Figure 6.A) was very low (<1.5%) meeting our minimum acceptable criteria. T11-F-N was higher than the other samples at ~1.5%. The pUC19 plasmid DNA CpH methylation (Figure 6.B) was low (<2%), however T11-F-O was 6%. This is higher than our expectation, however considering that this sample had only 32 reads, this is likely only due to an extremely low sample size. The same explanation can be used to answer why T09-F-O had 0% CpH methylation, as there were only 8 reads of the pUC19 plasmid from this sample. The lambda phage DNA CpH methylation (Figure 6.C) was low (<1.5%), meeting our minimum acceptable criteria. T11-F-N was again greater than the other samples at ~1.5%. The mitochondrial chromosome CpH methylation (figure 6.D) was low (<1.5%) meeting our minimum acceptability criteria but T11-F-N was again greater than the other samples at ~1.5%.
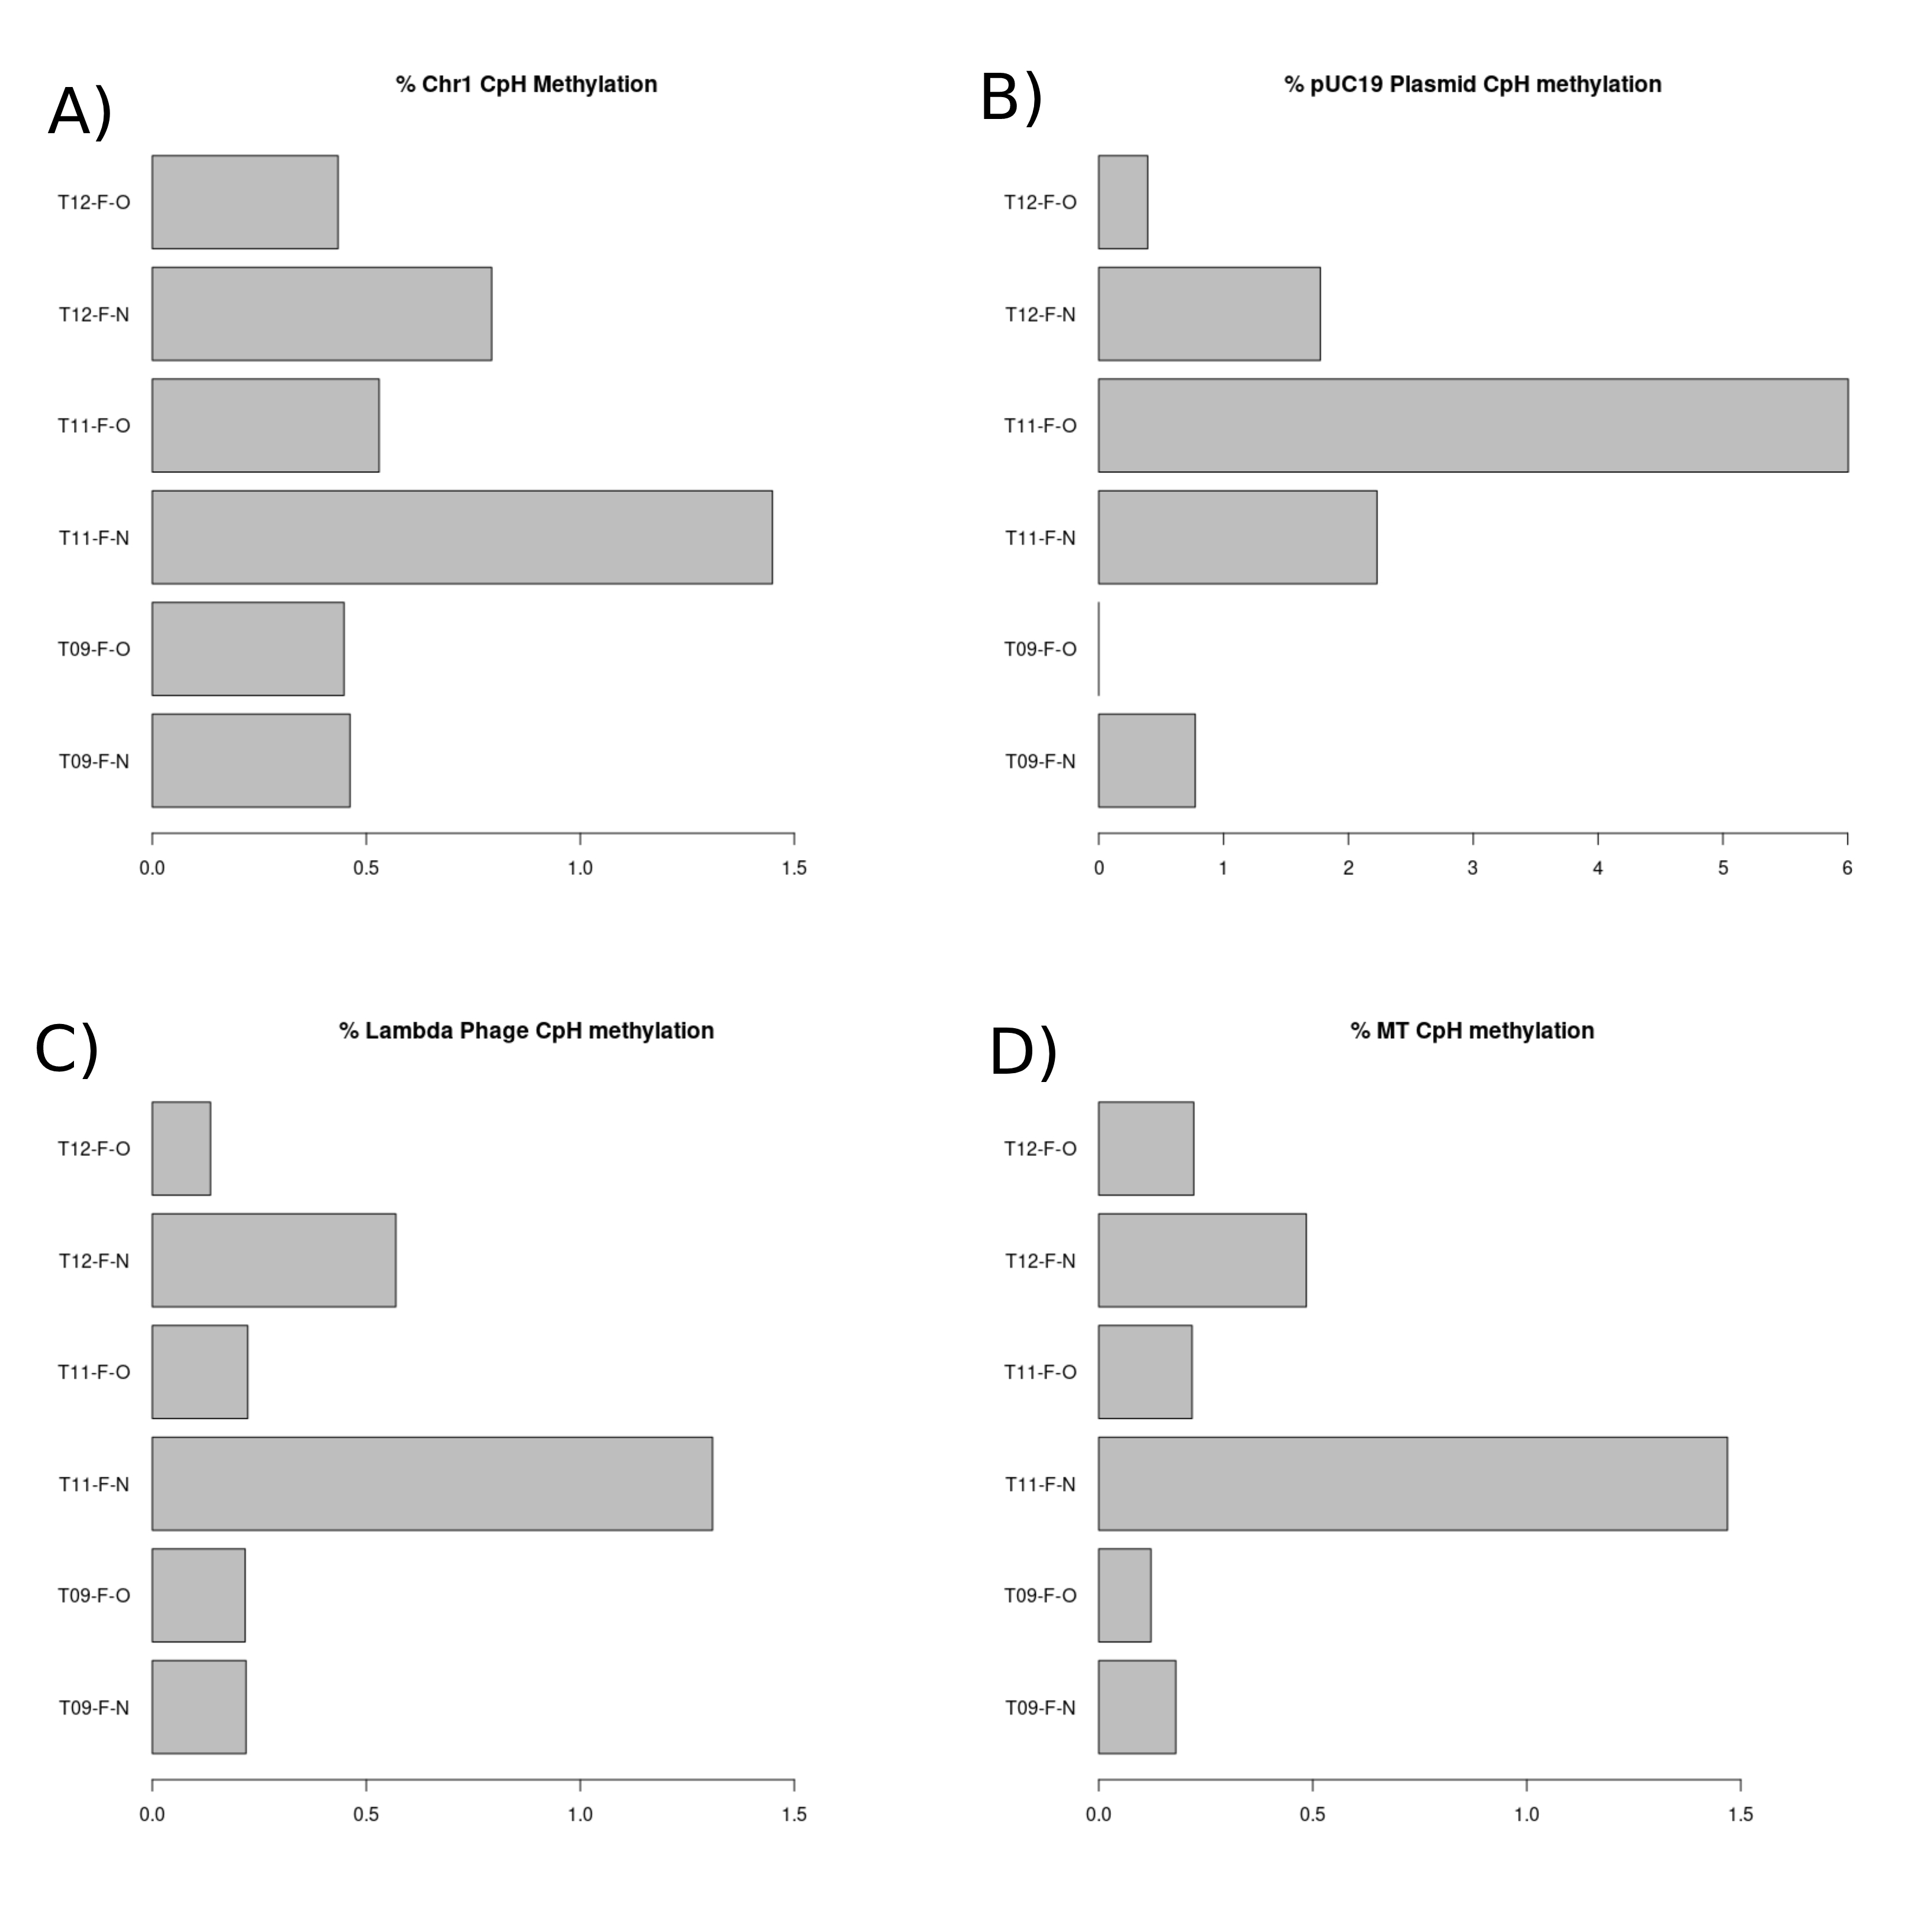
Figure 3.4: CpH methylation percentage present in each sample. (A) Bar chart displaying the CpH methylation present in chromosome 1 of each sample. (B) Bar chart displaying the CpH methylation present in the spiked in pUC19 plasmid DNA in each of the samples. (C) Bar chart displaying the CpH methylation present in the spiked in lambda phage DNA in each of the samples. (D) Bar chart displaying the CpH methylation present in the mitochondrial chromosome in each of the samples.
3.1.5 Total/Duplicate reads
The expectation for the total reads of each sample is to be not greater than 28 million divided by 6 (4,666,667). This is due to the capacity of the MiniSeq sequencing system. We also expect relatively little variation among the samples. Each of our samples had less than 4,666,667 total reads with minimal variation among the samples. The percentage of duplicate reads is expected to be low (<5%) as the pilot study contained a very low number of reads in each sample (7.A) when compared to the necessary amount to perform whole genome methylation profiling. As the sequencing depth rises, the expected number of duplicate reads also rises. The percentage of duplicate reads (Figure 7.B) for each sample was low (<2%) as expected.
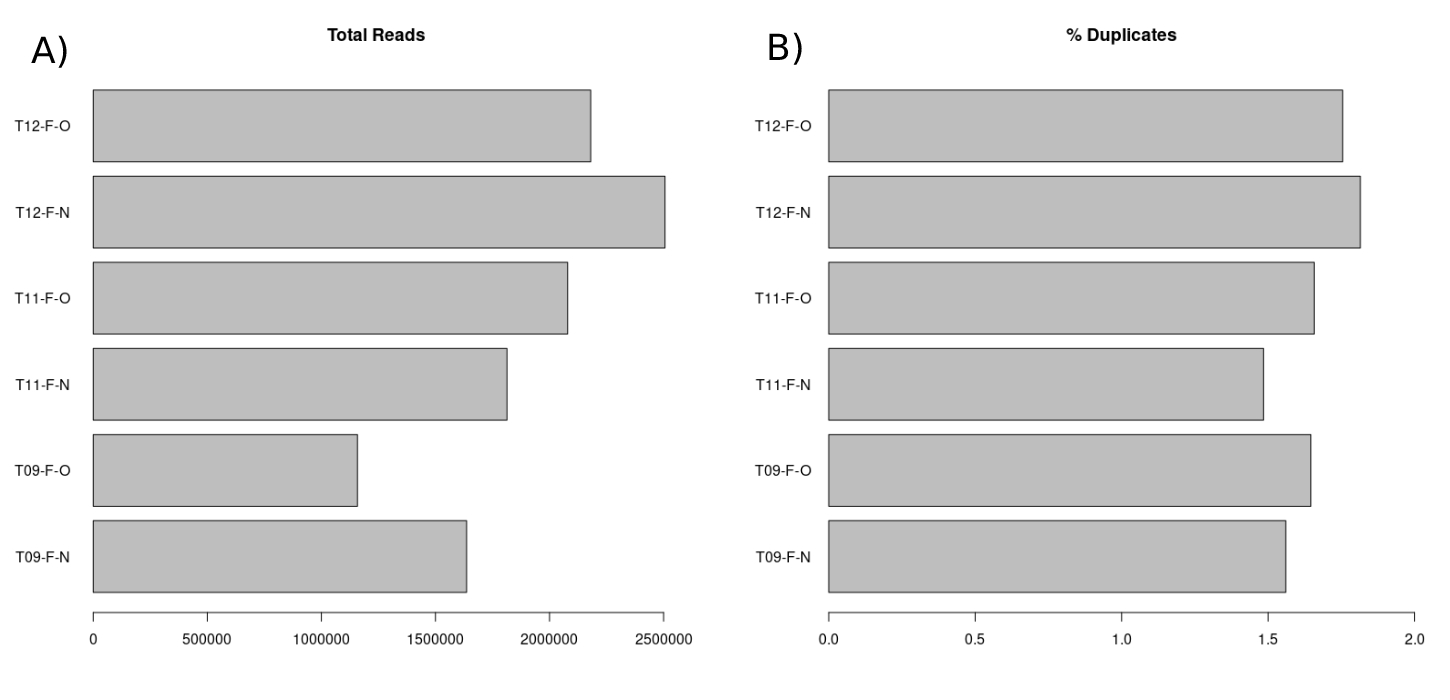
Figure 3.5: (A) Bart chart displaying the total number of reads for each sample. (B) Bar chart displaying the percentage of these reads which are duplicates for each sample.
3.1.6 Wasted bases analysis
An article entitled “Data quality of whole genome bisulfite sequencing on Illumina platforms” (Raine et al. 2018) provides a table of percentage yield for 25 different library preparations/sequencing techniques. The majority of these had only 45-55% yield and the greatest percentage yield was 75%. Using these examples as a benchmark we could consider our 79.9% yield (Figure 8) from our wasted bases analysis very high. We also expect consistency between our samples as each of them have a similar number of total reads (and therefore duplicate reads) and the same sequencing and library preparation techniques were used on each sample. Each of our samples had consistent percentage yield with only a ~2-3% deviations between the samples (figure x)
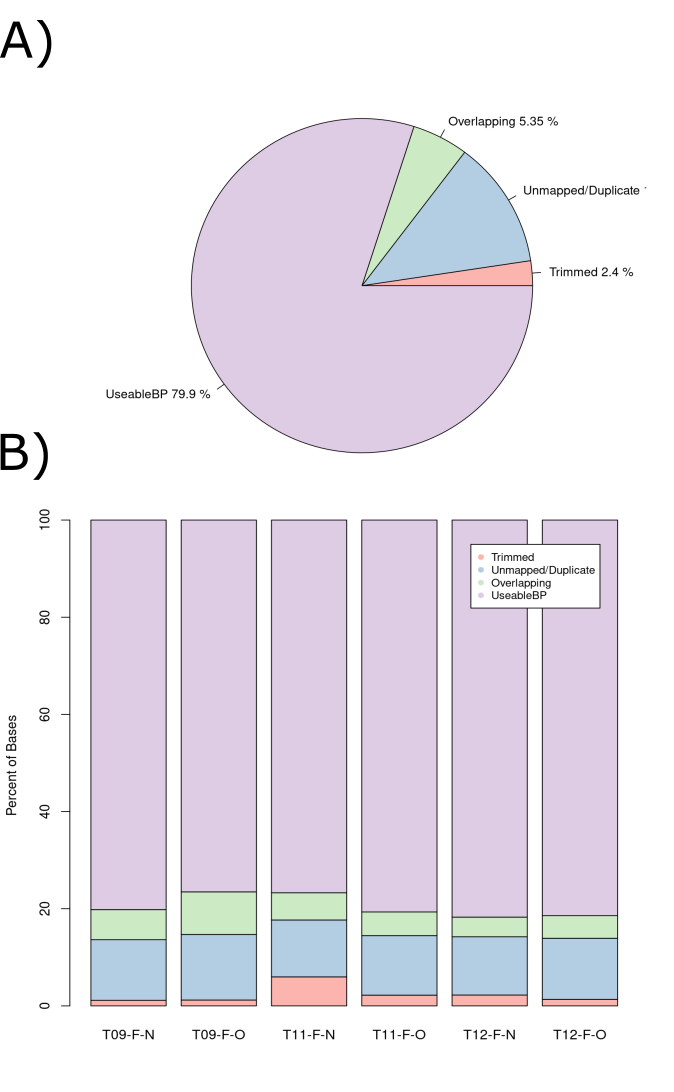
Figure 3.6: Percentage of total wasted bases at each data processing step. (A) A pie chart of all reads in the pilot study. (B) A stacked bar chart displaying the breakdown for each sample.
3.2 Main data QC
We performed a main data QC analysis as outlined in section 2.2 to ensure that our methylation profiling results were reliable. Our expectations for many of the Main data QC results do not deviate from the corresponding pilot study expectations, refer to section 3.1 to see these expectations.
3.2.1 Percentage CpG methylation
The Chr1, pUC19, lambda phage and mitochondrial chromosome CpG methylation pilot study and main study expectations are identical. All of the Chr1 samples had a similar CpG methylation percentage and ranged from ~72% to ~75% (figure 9.A). The pUC19 plasmid CpG methylation percentage (Figure 9.B) for each of our samples was >97% and there was minimal variation among the samples (~2%). The lambda phage DNA CpG methylation percentage (Figure 9.C) for each of our samples was <1%. The variability among the samples for this metric was also low (~0.1%). The CpG methylation within the Mitochondrial chromosome was very low (<0.3%) and there was minimal variation among the samples (<0.1%) (Figure XD).
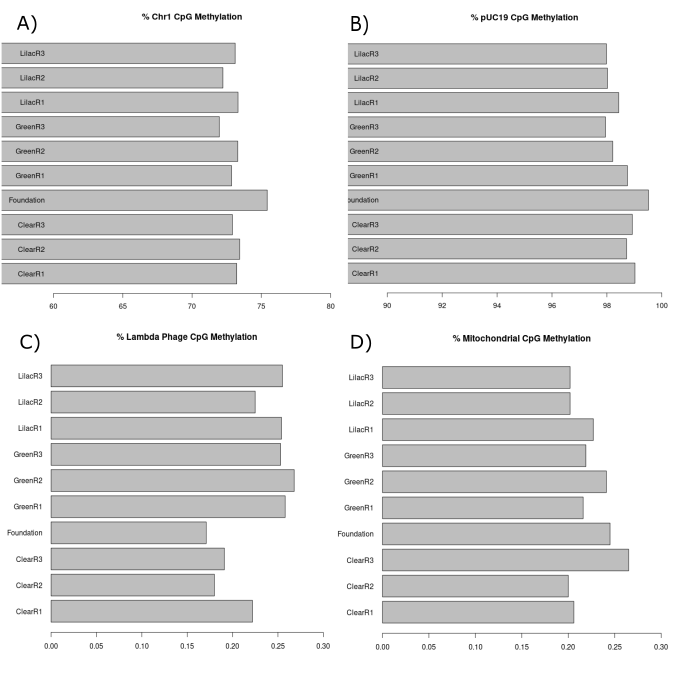
Figure 3.7: CpG methylation percentage present in each sample of the main data. (A) Bar chart displaying the CpG methylation present in chromosome 1 of each sample. (B) Bar chart displaying the CpG methylation present in the spiked in pUC19 plasmid DNA in each of the samples. (C) Bar chart displaying the CpG methylation present in the spiked in lambda phage DNA in each of the samples. (D) Bar chart displaying the CpG methylation present in the mitochondrial chromosome in each of the samples.
3.2.2 Insert Length
Like the pilot study, the main study was also performed using 150-bp paired-end sequencing and therefore the insert size expectations do not differ from those of the pilot study. With the exception of Clear2F-R3 all of the samples had a median insert length >300 bp. Clear2F-R3 had slightly <300 bp (Figure 10). These results are an improvement on the suzuki et al. (2018) expectations.
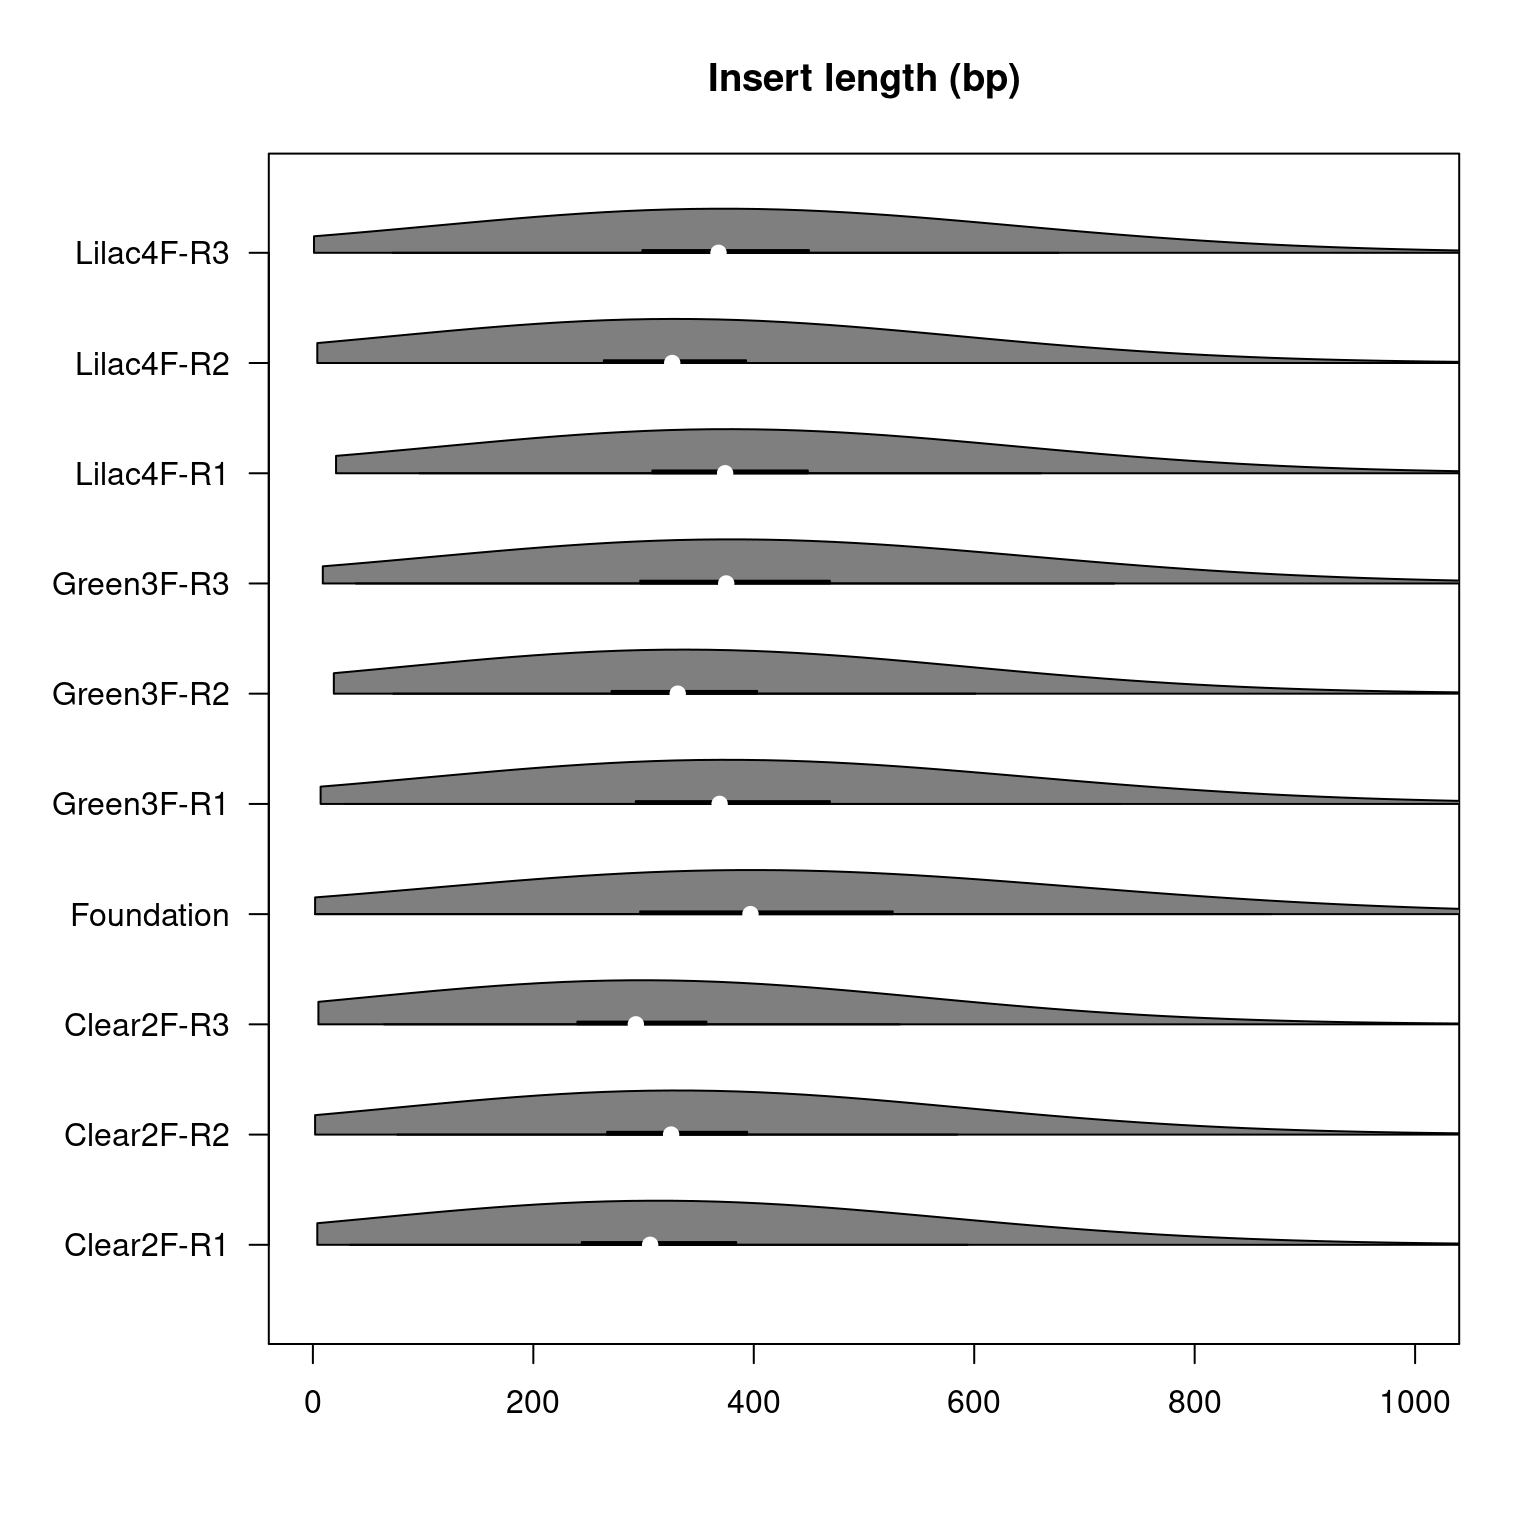
Figure 3.8: Violin plot displaying the insert lengths in base pairs within each sample of the main study. The ends of the black line under each violin indicate the interquartile range and the white indentation within the black line indicates the median.
3.2.3 Read Length
Because 150-bp paired-end sequencing was performed, we have the same read length expectations as the pilot study. The mean read length was ~150.5 bp for the forward reads of each sample and ~149.5 for the reverse reads of each sample (Figure 11). Little variation existed between the samples. These results are evidence of high quality sequencing.
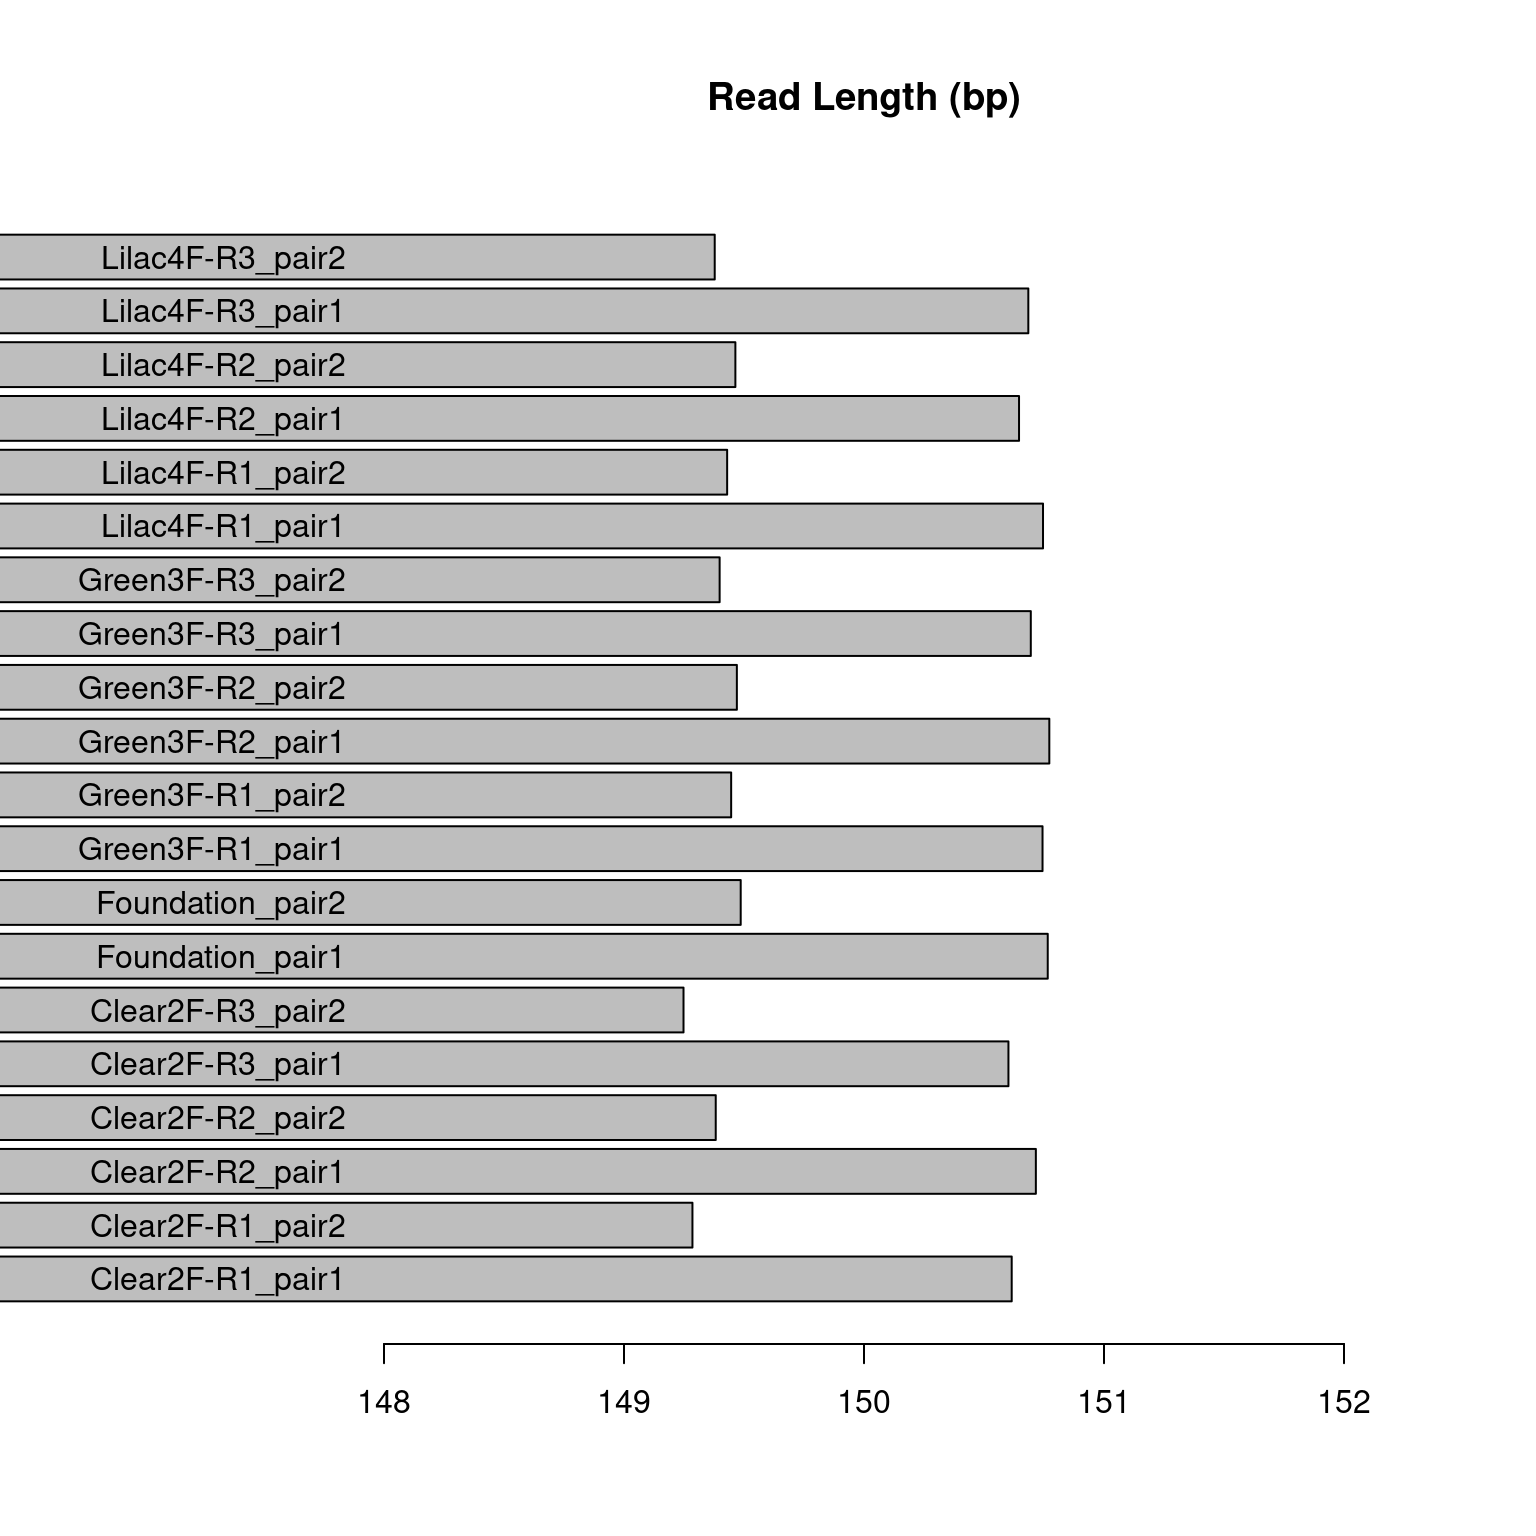
Figure 3.9: Figure displaying the mean read length in base pairs for each sample pair in the main study. The samples labeled “pair2” are the forward reads and the samples labeled “pair1” are the reverse reads.
3.2.4 Total/Duplicate Reads
A large number of reads for each sample is required in order to have satisfactory coverage of the genome when performing whole genome methylation sequencing. The guppy genome is 731,622,281 bp in length (Howe et al. 2021) and The US National Institutes of Health (NIH) Roadmap Epigenomics Project recommends 30x coverage of the human genome when considering all replicates in order to properly perform whole genome bisulfite sequencing (Michael J Ziller et al. 2014). Considering our reads are 150 bp in length on average and we need 30x coverage, we expect to have >146,324,456.2 total reads per light condition (731,622,281x30/150). Considering all of our samples have >70,000,000 reads per replicate (figure 12), they each have >210,000,000 reads per light condition and therefore more than adequate coverage of the guppy genome. As there is only one foundation sample it must have >146,324,456.2 total reads. This sample has 151,547,956 total reads which is also more than adequate coverage of the guppy genome.
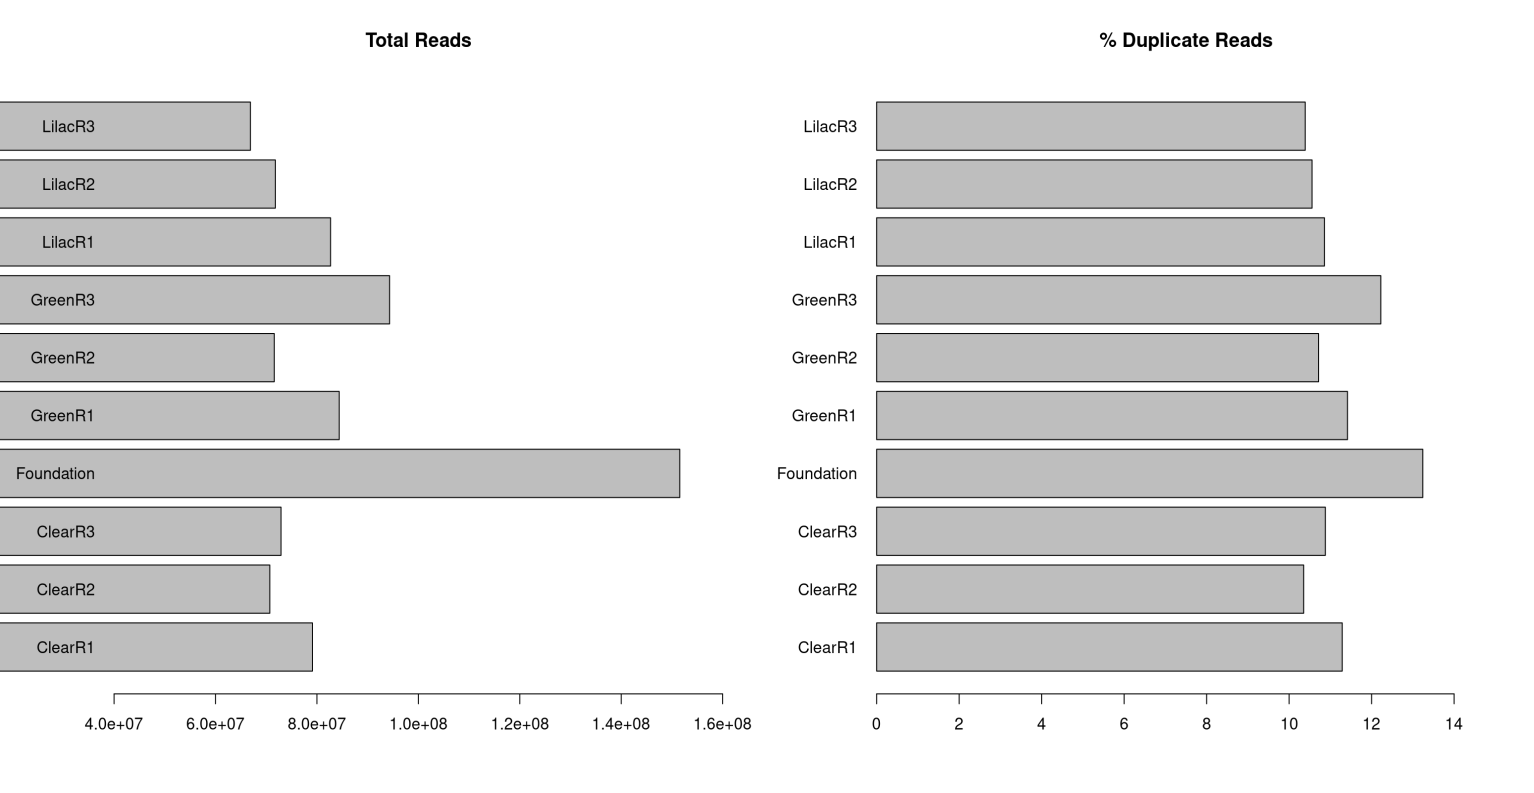
Figure 3.10: (A) Bart chart displaying the total number of reads for each sample. (B) Bar chart displaying the percentage of these reads which are duplicates for each sample.
3.2.5 Wasted bases analysis
The percentage yield expectations do not deviate from the pilot study percentage yield expectations. As we achieved a far greater sequencing depth in the main study, a reduction in percentage yield is expected. The 72.6% yield obtained in our main study (figure 13) is less than the 79.9% yield of the pilot study but still very high compared to other studies which involve whole genome bisulfite sequencing. This indicates that the NEBnext kit’s reduction in DNA degradation aids in producing a greater yield than would usually be acquired performing bisulfite sequencing. ClearR1 and LilacR3 had a significantly higher percentage of Unmapped/Duplicate reads than the other samples. The number of duplicate reads for each of the samples was consistent and therefore the problem was due to difficulty in mapping the reads to the reference genome.
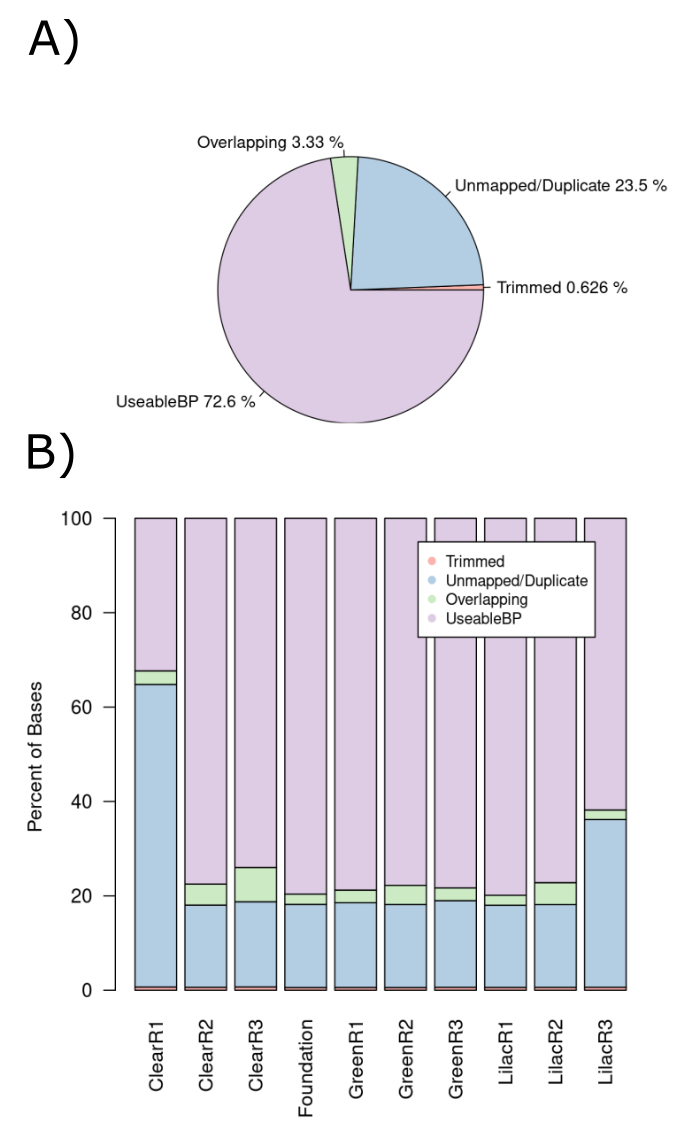
Figure 3.11: Percentage of total wasted bases at each data processing step. (A) A pie chart of all reads in the pilot study. (B) A stacked bar chart displaying the breakdown for each sample.
3.2.6 Fold coverage
To assess the genome coverage after taking into account the wasted bases, a plot which displays the coverage of each sample was created (figure 14). Combining the 3 replicates of each light condition, they easily surpass 30x coverage. These results indicate quality coverage of the guppy genome for whole genome bisulfite sequencing.
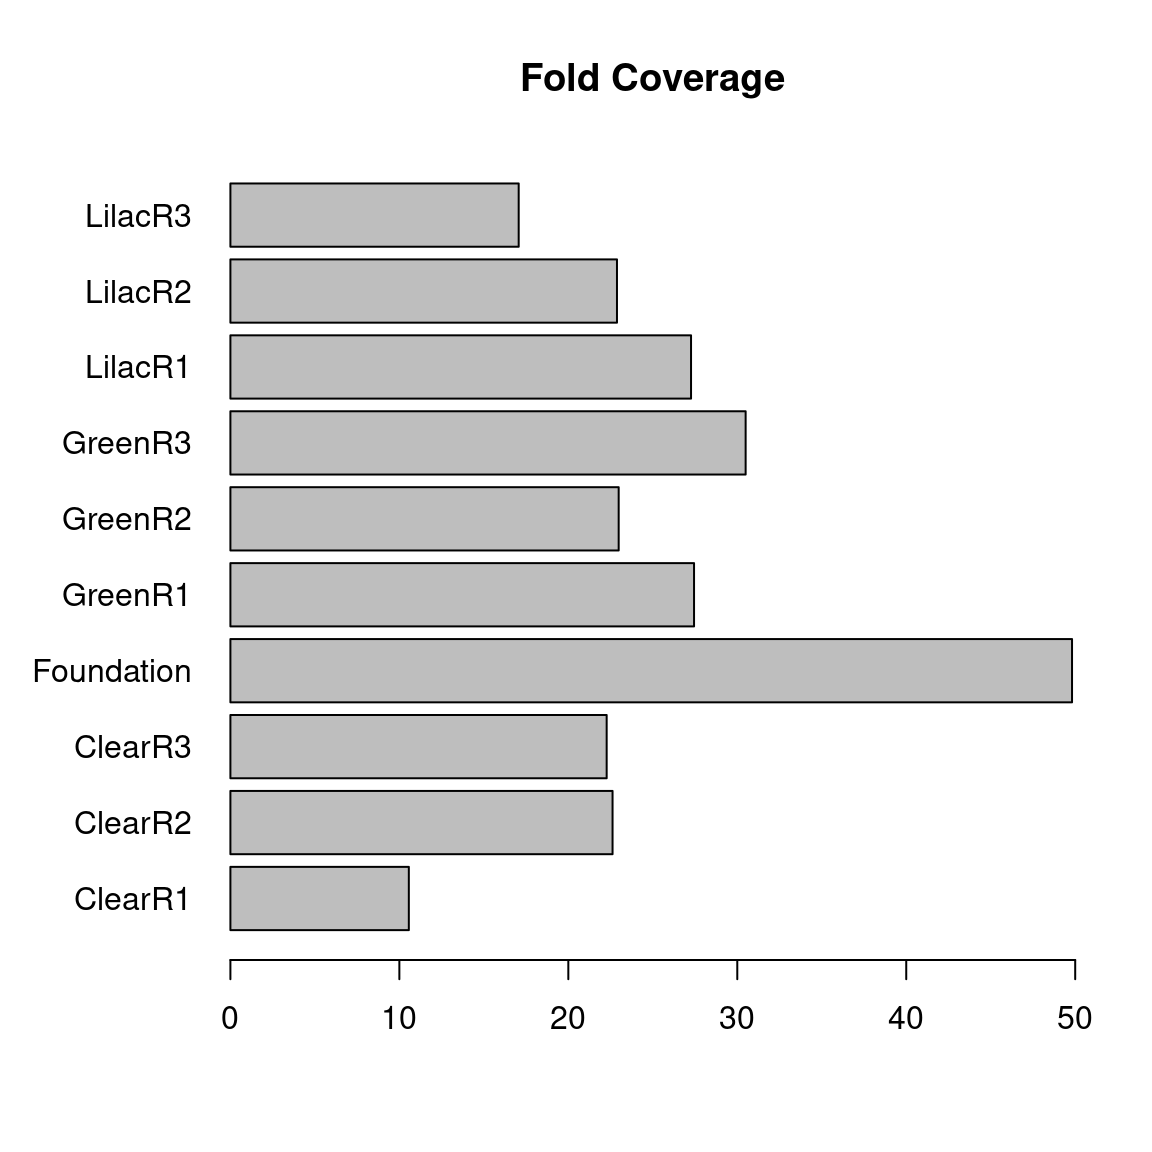
(#fig:figure 14)Barchart displaying the fold coverage for each sample.
3.3 Principal component analysis and correlation heatmaps
If the experimental conditions resulted in significant changes in the guppy methylome that outweigh the effects of biological variability then we would expect to see separation of the biological conditions and the foundation population from one another on the PCA plot. We would also expect to see greater correlation within the light conditions than between than light conditions. This would be represented by colour distinctions between light conditions on the heatmap and clustering of the light condition replicates outside of the heatmap.
For both the CpG site (figure 15.A) and tile methylation (figure 15.B) we see clumping of most samples. On the CpG PCA plot clear1 and lilac 3 are distanced from the rest of the samples whereas on the tile PCA plot clear1 and foundation are separated from the rest of the samples.
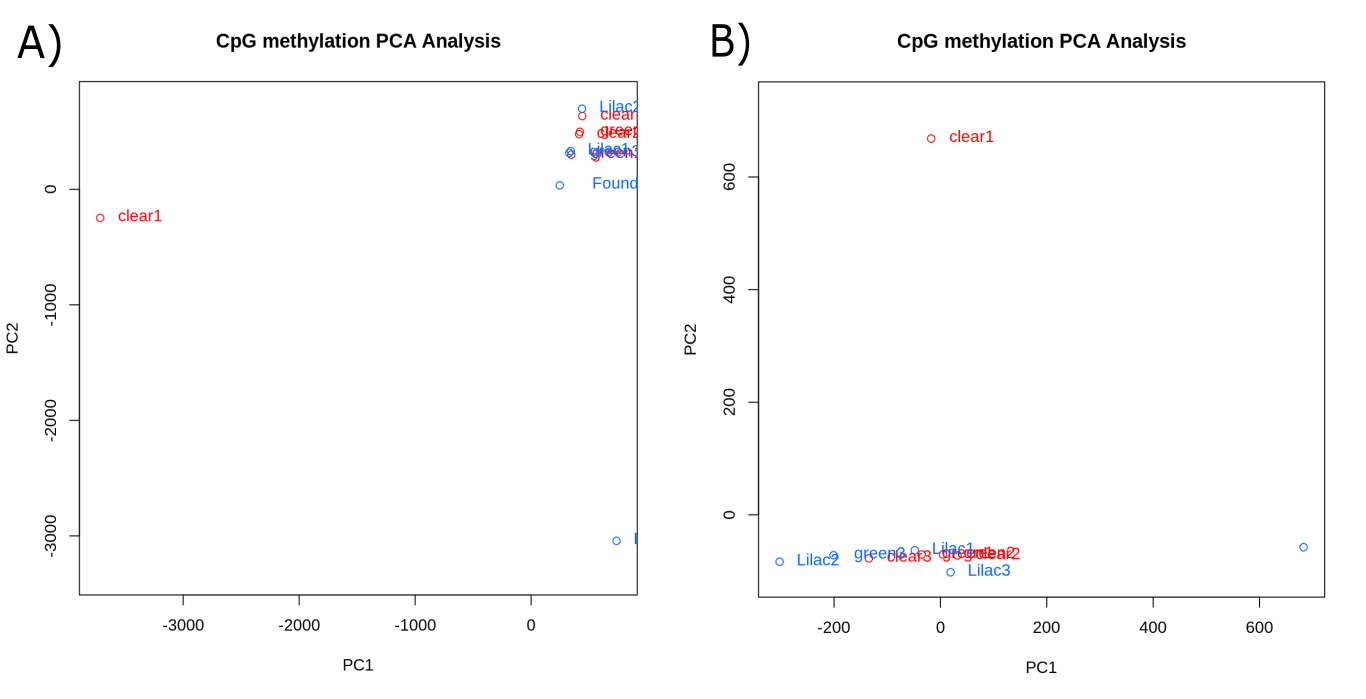
Figure 3.12: PCA plots created using CpG methylation data. (A) A PCA plot created using CpG methylation data at the CpG site scale. (B) A PCA plot created using CpG methylation data at the tile scale.
The correlation relationships displayed on each of the heatmaps (figure 16.A, 16.B, 16.C and 16.D) were similar with small distinctions. All of the heat maps displayed close relationships between the green replicates. The heatmaps overall displayed little consistency in the relationships between the lilac replicates. They also displayed little consistency between the clear replicates. In all four of the heatmaps clear1 had little correlation to any of the other samples. In the CpG site correlation heatmaps (figure 16.A and 16.C) the foundation sample was closely related to the others. However, in the tile correlation heatmaps (figure 16.B and 16.D) The foundation had little correlation to any of the other samples.
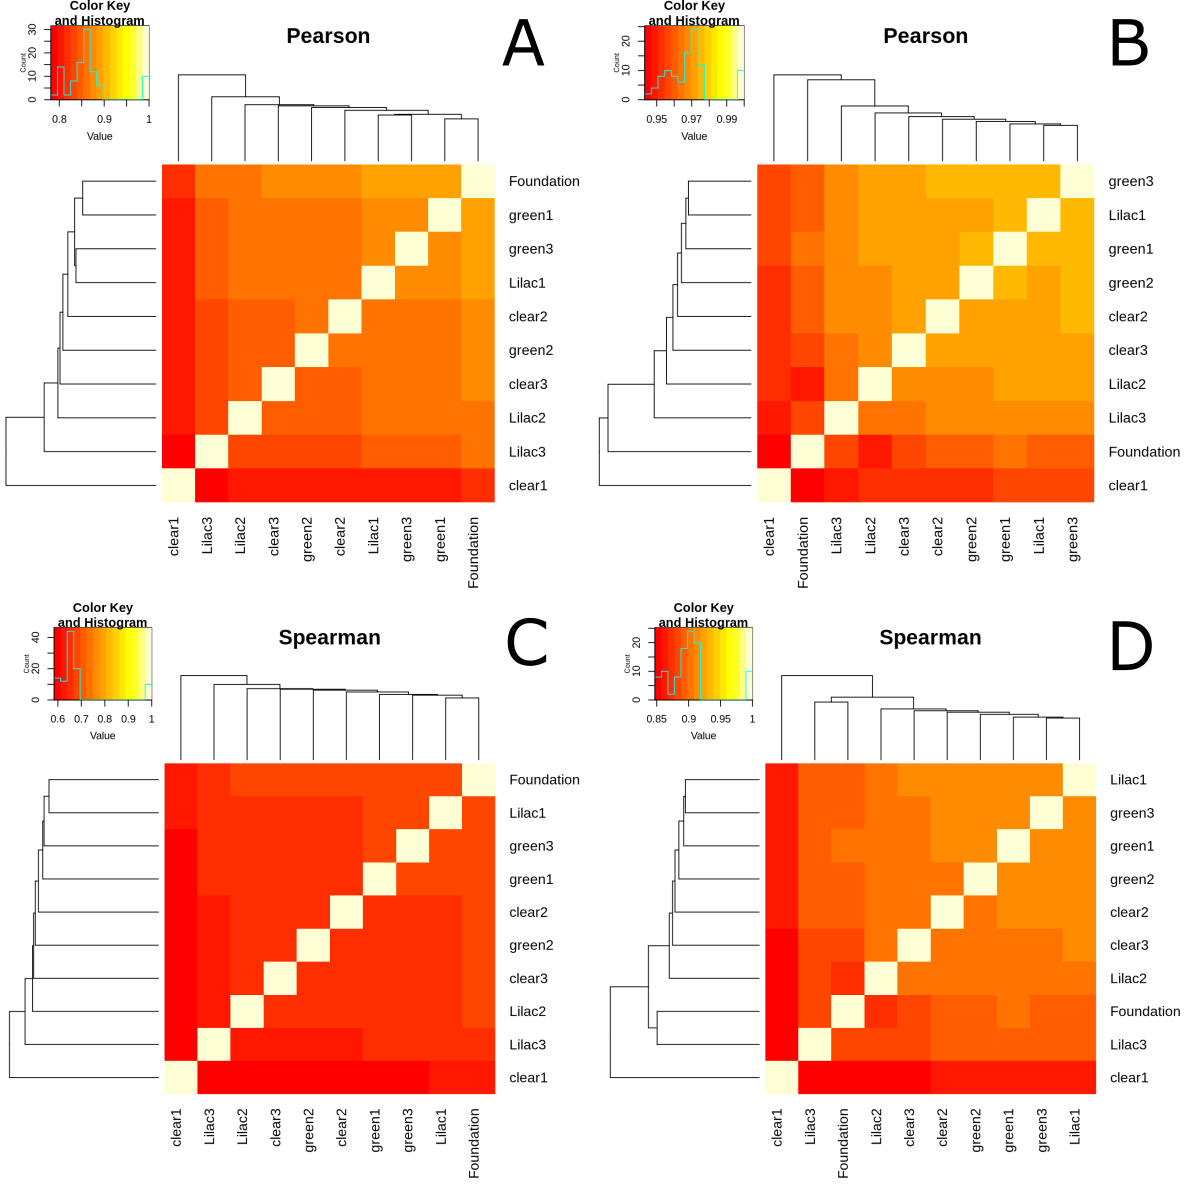
Figure 3.13: Correlation heatmaps generated using CpG methylation data. (A) A Pearson correlation heatmap created using CpG methylation data at the CpG site scale. (B) A Pearson correlation heatmap created using CpG methylation data at the tile scale. (C) (A) A Spearman correlation heatmap created using CpG methylation data at the CpG site scale. (D) A Spearman correlation heatmap created using CpG methylation data at the tile scale.
3.4 Differential Methylation Analysis
The differential methylation analysis was performed to understand if the experimental conditions resulted in differential methylation in the genes or promoter regions of genes. This differential methylation is likely to alter the expression levels of identified genes. As the DNA was extracted from the brain and eyes of the fish we expect to see significantly differentiated tiles associated with genes that are expressed in the eyes and central nervous system. It is also expected that these genes can be in some way linked to the experimental conditions, meaning that the alteration of expression levels confer a sexual selective advantage under altered light conditions.
3.4.1 dmrseq
| LightComp | location | width | L | beta | pvalue | qvalue |
|---|---|---|---|---|---|---|
| CvG | LG21 | 1075 | 69 | -0.5126778 | 3.17e-05 | 0.7193775 |
| CvG | LG13 | 755 | 75 | 0.4804793 | 4.01e-05 | 0.7193775 |
| CvG | LG8 | 75 | 22 | -0.3598625 | 4.12e-05 | 0.7193775 |
| CvG | KK215287.1 | 372 | 42 | -0.3577019 | 4.22e-05 | 0.7193775 |
| CvG | KK215308.1 | 365 | 65 | -0.3030945 | 4.44e-05 | 0.7193775 |
| CvG | LG2 | 834 | 53 | -0.3978501 | 4.54e-05 | 0.7193775 |
| CvG | LG5 | 272 | 61 | 0.3785743 | 6.44e-05 | 0.7193775 |
| CvG | KK215283.1 | 583 | 78 | 0.3357201 | 8.45e-05 | 0.7193775 |
| CvG | LG10 | 420 | 46 | 0.4390605 | 9.08e-05 | 0.7193775 |
| CvG | LG13 | 1545 | 81 | -0.3413481 | 9.40e-05 | 0.7193775 |
| LightComp | location | width | L | beta | pvalue | qvalue |
|---|---|---|---|---|---|---|
| CvL | LG19 | 686 | 71 | 0.5767663 | 0.000001 | 0.1114369 |
| CvL | LG21 | 737 | 81 | 0.4647484 | 0.000008 | 0.4457476 |
| CvL | KK215293.1 | 492 | 61 | 0.3911403 | 0.000040 | 0.9103295 |
| CvL | LG13 | 495 | 82 | 0.4397952 | 0.000066 | 0.9103295 |
| CvL | KK215283.1 | 685 | 104 | 0.3613973 | 0.000066 | 0.9103295 |
| CvL | LG17 | 465 | 61 | -0.4012925 | 0.000071 | 0.9103295 |
| CvL | LG8 | 660 | 60 | -0.3746378 | 0.000074 | 0.9103295 |
| CvL | LG11 | 365 | 58 | -0.3570840 | 0.000081 | 0.9103295 |
| CvL | LG2 | 316 | 76 | 0.3183476 | 0.000101 | 0.9103295 |
| CvL | LG4 | 1206 | 85 | -0.3823658 | 0.000107 | 0.9103295 |
| LightComp | location | width | L | beta | pvalue | qvalue |
|---|---|---|---|---|---|---|
| GvL | LG11 | 505 | 108 | -0.2773737 | 7.10e-06 | 0.6538511 |
| GvL | KK215283.1 | 779 | 156 | 0.3291269 | 1.79e-05 | 0.7492043 |
| GvL | LG20 | 950 | 73 | 0.4755714 | 2.50e-05 | 0.7492043 |
| GvL | LG1 | 1386 | 78 | 0.3515985 | 4.64e-05 | 0.7492043 |
| GvL | LG2 | 1438 | 65 | 0.4626823 | 5.48e-05 | 0.7492043 |
| GvL | LG13 | 886 | 95 | -0.3970642 | 5.60e-05 | 0.7492043 |
| GvL | KK215287.1 | 202 | 36 | -0.4584372 | 6.07e-05 | 0.7492043 |
| GvL | LG11 | 376 | 75 | 0.3701602 | 6.55e-05 | 0.7492043 |
| GvL | KK215306.1 | 715 | 68 | 0.4324903 | 7.62e-05 | 0.7749346 |
| GvL | LG5 | 272 | 58 | -0.3990748 | 9.29e-05 | 0.7879743 |
The differential methylation analysis run using dmrseq yielded no significantly differentially methylated regions (dmrs) (table 2). The most differentiated regions for the clear versus green comparison were associated with a q-value of 0.719. The most differentiated region for the clear versus lilac comparison was associated with a q-value of 0.111 which was the closest to a statistically significant region. The most differentiated region for the green versus lilac comparison was associated with a q-value of 0.654.
| LightComp | location | width | L | beta | pvalue | qvalue | gene_name | |
|---|---|---|---|---|---|---|---|---|
| 1 | CvG | LG13 | 755 | 75 | 0.4804793 | 0.0000401 | 0.7193775 | NA |
| 2 | CvG | LG8 | 75 | 22 | -0.3598625 | 0.0000412 | 0.7193775 | btr30 |
| 3 | CvG | LG8 | 75 | 22 | -0.3598625 | 0.0000412 | 0.7193775 | NA |
| 5 | CvG | LG5 | 272 | 61 | 0.3785743 | 0.0000644 | 0.7193775 | NA |
| 6 | CvG | LG5 | 272 | 61 | 0.3785743 | 0.0000644 | 0.7193775 | asb14a |
| 8 | CvG | LG10 | 420 | 46 | 0.4390605 | 0.0000908 | 0.7193775 | NFKB1 |
| 9 | CvG | LG13 | 1545 | 81 | -0.3413481 | 0.0000940 | 0.7193775 | capn12 |
| 10 | CvG | LG19 | 686 | 70 | 0.4116465 | 0.0001215 | 0.7193775 | QRFPR |
| 11 | CvG | LG19 | 245 | 47 | -0.2756728 | 0.0001267 | 0.7193775 | eif3c |
| 13 | CvG | LG20 | 409 | 61 | 0.2998656 | 0.0001289 | 0.7193775 | NA |
| LightComp | location | width | L | beta | pvalue | qvalue | gene_name | |
|---|---|---|---|---|---|---|---|---|
| 1 | CvL | LG19 | 686 | 71 | 0.5767663 | 0.000001 | 0.1114369 | QRFPR |
| 3 | CvL | LG13 | 495 | 82 | 0.4397952 | 0.000066 | 0.9103295 | ankrd13b |
| 6 | CvL | LG8 | 660 | 60 | -0.3746378 | 0.000074 | 0.9103295 | rapgefl1 |
| 7 | CvL | LG11 | 365 | 58 | -0.3570840 | 0.000081 | 0.9103295 | NA |
| 8 | CvL | LG14 | 1196 | 45 | -0.4990115 | 0.000121 | 0.9103295 | rab34b |
| 10 | CvL | LG12 | 310 | 58 | -0.3274811 | 0.000139 | 0.9103295 | NA |
| 11 | CvL | LG19 | 538 | 66 | -0.5147304 | 0.000140 | 0.9103295 | SHANK1 |
| 12 | CvL | LG19 | 845 | 70 | -0.5136342 | 0.000141 | 0.9103295 | bhlha15 |
| 13 | CvL | LG16 | 354 | 39 | 0.4346024 | 0.000147 | 0.9103295 | atp2c1 |
| 14 | CvL | LG22 | 403 | 45 | 0.3348768 | 0.000162 | 0.9103295 | map4k5 |
| LightComp | location | width | L | beta | pvalue | qvalue | gene_name | |
|---|---|---|---|---|---|---|---|---|
| 1 | GvL | LG11 | 505 | 108 | -0.2773737 | 0.0000071 | 0.6538511 | ncdn |
| 4 | GvL | LG2 | 1438 | 65 | 0.4626823 | 0.0000548 | 0.7492043 | casq2 |
| 5 | GvL | LG13 | 886 | 95 | -0.3970642 | 0.0000560 | 0.7492043 | NA |
| 7 | GvL | LG11 | 376 | 75 | 0.3701602 | 0.0000655 | 0.7492043 | jazf1a |
| 9 | GvL | LG5 | 272 | 58 | -0.3990748 | 0.0000929 | 0.7879743 | NA |
| 10 | GvL | LG5 | 272 | 58 | -0.3990748 | 0.0000929 | 0.7879743 | asb14a |
| 11 | GvL | LG16 | 1107 | 52 | 0.4267220 | 0.0000976 | 0.7879743 | NA |
| 12 | GvL | LG16 | 981 | 88 | -0.3991232 | 0.0001060 | 0.7879743 | NA |
| 14 | GvL | LG17 | 704 | 67 | -0.4174846 | 0.0001357 | 0.7879743 | NA |
| 15 | GvL | LG5 | 413 | 46 | 0.3130988 | 0.0001357 | 0.7879743 | dlgap4b |
| LightComp | location | width | beta | pvalue | qvalue | gene_name | |
|---|---|---|---|---|---|---|---|
| 1 | CvG | LG5 | 272 | 0.3785743 | 0.0000644 | 0.7193775 | asb14a |
| 5 | CvG | LG11 | 520 | 0.4028755 | 0.0001320 | 0.7193775 | uncharacterised |
| 6 | CvG | LG4 | 523 | 0.2888801 | 0.0001394 | 0.7193775 | uncharacterised |
| 7 | CvG | LG1 | 683 | -0.4086131 | 0.0001700 | 0.7193775 | uncharacterised |
| 8 | CvG | LG14 | 1570 | -0.2718633 | 0.0002366 | 0.7193775 | ppm1nb |
| 9 | CvG | LG5 | 580 | -0.3328806 | 0.0003844 | 0.7193775 | GRM7 |
| 11 | CvG | LG11 | 684 | -0.2993888 | 0.0004034 | 0.7193775 | meaf6 |
| 12 | CvG | LG18 | 514 | -0.3258269 | 0.0004151 | 0.7193775 | uncharacterised |
| 13 | CvG | LG18 | 514 | -0.3258269 | 0.0004151 | 0.7193775 | uncharacterised |
| 14 | CvG | LG9 | 362 | -0.3274617 | 0.0004151 | 0.7193775 | tbc1d10aa |
| LightComp | location | width | beta | pvalue | qvalue | gene_name | |
|---|---|---|---|---|---|---|---|
| 7 | CvL | LG11 | 365 | -0.3570840 | 0.000081 | 0.9103295 | uncharacterised |
| 8 | CvL | LG11 | 365 | -0.3570840 | 0.000081 | 0.9103295 | uncharacterised |
| 9 | CvL | LG16 | 337 | -0.3099585 | 0.000184 | 0.9103295 | uncharacterised |
| 10 | CvL | LG16 | 337 | -0.3099585 | 0.000184 | 0.9103295 | uncharacterised |
| 11 | CvL | LG16 | 337 | -0.3099585 | 0.000184 | 0.9103295 | uncharacterised |
| 12 | CvL | LG4 | 586 | 0.3158647 | 0.000311 | 0.9103295 | uncharacterised |
| 13 | CvL | LG1 | 1035 | -0.2763986 | 0.000340 | 0.9103295 | slc25a4 |
| 14 | CvL | LG23 | 727 | -0.4336691 | 0.000489 | 0.9103295 | ppfia2 |
| 15 | CvL | LG7 | 847 | 0.5276226 | 0.000491 | 0.9103295 | uts2a |
| 18 | CvL | LG7 | 815 | 0.3494188 | 0.000607 | 0.9261309 | zgc:198371 |
| LightComp | location | width | beta | pvalue | qvalue | gene_name | |
|---|---|---|---|---|---|---|---|
| 1 | GvL | LG11 | 505 | -0.2773737 | 0.0000071 | 0.6538511 | tfap2e |
| 8 | GvL | LG5 | 272 | -0.3990748 | 0.0000929 | 0.7879743 | asb14a |
| 10 | GvL | LG17 | 704 | -0.4174846 | 0.0001357 | 0.7879743 | uncharacterised |
| 11 | GvL | LG17 | 704 | -0.4174846 | 0.0001357 | 0.7879743 | uncharacterised |
| 12 | GvL | LG4 | 576 | 0.3020933 | 0.0002084 | 0.7879743 | ppat |
| 13 | GvL | LG21 | 568 | -0.2600441 | 0.0002131 | 0.7879743 | entpd5b |
| 14 | GvL | LG22 | 1187 | 0.3227734 | 0.0003298 | 0.9737459 | uncharacterised |
| 15 | GvL | LG1 | 388 | 0.2553471 | 0.0003655 | 0.9928849 | uncharacterised |
| 16 | GvL | LG17 | 2289 | 0.2363804 | 0.0005251 | 0.9998670 | MYOC |
| 17 | GvL | LG18 | 927 | -0.3148876 | 0.0005537 | 0.9998670 | uncharacterised |
The dmrs that were identified were annotated to the promoter regions of genes (table 3, 4 and 5). The most differentiated regions from the lilac versus clear comparison were not able to be annotated to any promoter regions. The region with the lowest q-value which was annotated to a gene was associated with a q-value of 0.654 and was from the green versus lilac comparison. This means we did not have any regions close to being deemed differentially methylated by dmrseq that were annotated to a gene.
3.4.2 methylkit
3.4.2.1 CpG site level
| LightComp | location | pvalue | qvalue | meth.diff | |
|---|---|---|---|---|---|
| 14011068 | CvG | LG4 | 1.510121e-15 | 2.819262e-08 | 69.49153 |
| 14011071 | CvG | LG4 | 6.272684e-15 | 5.855272e-08 | 71.81818 |
| 14011018 | CvG | LG4 | 9.610321e-15 | 5.980539e-08 | 73.61963 |
| 14011020 | CvG | LG4 | 1.055213e-13 | 4.924975e-07 | 67.64706 |
| 14011073 | CvG | LG4 | 3.361816e-13 | 1.046036e-06 | 69.15584 |
| 14011075 | CvG | LG4 | 3.317211e-13 | 1.046036e-06 | 65.26210 |
| 14011017 | CvG | LG4 | 6.059313e-13 | 1.616029e-06 | 62.43094 |
| 14011016 | CvG | LG4 | 8.313745e-13 | 1.940128e-06 | 59.77654 |
| 14011077 | CvG | LG4 | 1.443677e-12 | 2.994685e-06 | 65.58559 |
| 14011014 | CvG | LG4 | 4.063471e-12 | 7.586140e-06 | 60.12658 |
| 8691557 | CvG | LG19 | 2.875857e-08 | 4.880882e-02 | 60.09818 |
| 3610880 | CvG | LG12 | 5.349979e-08 | 8.323281e-02 | -61.90476 |
| 5207011 | CvG | LG14 | 6.150734e-08 | 8.832981e-02 | 50.00000 |
| 6685875 | CvG | LG16 | 7.754818e-08 | 9.651705e-02 | -55.77342 |
| 12677287 | CvG | LG23 | 7.286739e-08 | 9.651705e-02 | 59.44056 |
| LightComp | location | pvalue | qvalue | meth.diff | |
|---|---|---|---|---|---|
| 7721640 | CvL | LG17 | 1.798548e-10 | 0.003278925 | -56.81818 |
| 8503892 | CvL | LG19 | 8.650817e-10 | 0.007885634 | 65.96774 |
| 11916736 | CvL | LG22 | 4.190343e-08 | 0.254646567 | 73.91304 |
| 231578 | CvL | KK215289.1 | 1.152627e-07 | 0.420269993 | 48.78205 |
| 11130041 | CvL | LG21 | 1.035762e-07 | 0.420269993 | -50.00000 |
| 325243 | CvL | KK215296.1 | 1.744510e-07 | 0.454344073 | 52.17391 |
| 8778728 | CvL | LG19 | 1.573263e-07 | 0.454344073 | -62.66667 |
| 6104680 | CvL | LG15 | 2.404266e-07 | 0.459360945 | 57.14286 |
| 8987858 | CvL | LG19 | 2.966095e-07 | 0.459360945 | -50.23847 |
| 10246492 | CvL | LG2 | 2.568048e-07 | 0.459360945 | -59.52381 |
| 11230076 | CvL | LG21 | 3.023610e-07 | 0.459360945 | 56.72269 |
| 14527798 | CvL | LG5 | 2.175832e-07 | 0.459360945 | -67.03297 |
| 8175112 | CvL | LG18 | 3.366633e-07 | 0.472130294 | -57.67974 |
| 3791209 | CvL | LG12 | 3.809787e-07 | 0.496114701 | 64.53804 |
| 1368825 | CvL | LG1 | 9.371466e-07 | 0.504339931 | 48.00000 |
| LightComp | location | pvalue | qvalue | meth.diff | |
|---|---|---|---|---|---|
| 15775362 | GvL | LG4 | 5.358976e-19 | 1.121417e-11 | -69.27181 |
| 15775428 | GvL | LG4 | 4.085825e-16 | 4.274991e-09 | -68.91892 |
| 15775425 | GvL | LG4 | 1.170641e-15 | 6.124197e-09 | -69.78610 |
| 15775427 | GvL | LG4 | 1.160716e-15 | 6.124197e-09 | -68.38710 |
| 15775423 | GvL | LG4 | 2.302746e-15 | 9.637436e-09 | -71.92571 |
| 15775363 | GvL | LG4 | 7.446573e-12 | 2.597112e-05 | -56.01915 |
| 15775361 | GvL | LG4 | 1.483015e-11 | 4.433360e-05 | -52.01427 |
| 15775419 | GvL | LG4 | 5.926712e-11 | 1.550277e-04 | -56.33363 |
| 15775358 | GvL | LG4 | 1.834129e-10 | 4.264546e-04 | -51.03567 |
| 15775360 | GvL | LG4 | 7.537840e-10 | 1.577366e-03 | -48.66543 |
| 13288679 | GvL | LG21 | 1.359249e-08 | 2.585782e-02 | 45.71429 |
| 13652786 | GvL | LG22 | 1.705089e-08 | 2.973386e-02 | 50.00000 |
| 14854930 | GvL | LG3 | 4.672240e-08 | 7.520856e-02 | 51.85185 |
| 8247430 | GvL | LG17 | 5.842523e-08 | 8.732888e-02 | 59.65157 |
| 734635 | GvL | KK215575.1 | 6.462642e-08 | 9.015801e-02 | -44.18605 |
Table 5 displays the eleven significantly differentiated CpG sites and four CpG sites which were not significantly differentiated found by methylkit for the clear versus green comparison. The top ten sites were all in the same region on chromosome 4. Table 7 displays the two significantly differentiated CpG sites and thirteen CpG sites which were not significantly differentiated found by methylkit for the clear versus lilac comparison. Table x displays the twelve significantly differentiated CpG sites and three CpG sites which were not significantly differentiated found by methylkit for the green versus lilac comparison. The significantly differentiated green versus lilac sites were the same sites found in the green versus clear comparison.
| LightComp | location | pvalue | qvalue | meth.diff | gene_name | |
|---|---|---|---|---|---|---|
| 2512233 | CvG | LG19 | 2.875857e-08 | 0.04880882 | 60.09818 | tspan9a |
| 1495966 | CvG | LG14 | 6.150734e-08 | 0.08832981 | 50.00000 | spns3 |
| 1913935 | CvG | LG16 | 7.754818e-08 | 0.09651705 | -55.77342 | she |
| 3646593 | CvG | LG23 | 7.286739e-08 | 0.09651705 | 59.44056 | anks1b |
| 2870927 | CvG | LG2 | 1.907840e-07 | 0.15296608 | 50.54720 | cntnap5a |
| 3176259 | CvG | LG20 | 1.890608e-07 | 0.15296608 | 59.31174 | puf60a |
| 2349025 | CvG | LG18 | 2.531751e-07 | 0.15642075 | 53.50000 | sorcs2 |
| 3944752 | CvG | LG3 | 2.499710e-07 | 0.15642075 | 51.76768 | RASGRF1 |
| 2480021 | CvG | LG19 | 2.917105e-07 | 0.17018678 | -59.05316 | SHANK1 |
| 778072 | CvG | LG11 | 4.698010e-07 | 0.23111492 | -55.55556 | NA |
| LightComp | location | pvalue | qvalue | meth.diff | gene_name | |
|---|---|---|---|---|---|---|
| 2460944 | CvL | LG19 | 8.650817e-10 | 0.007885634 | 65.96774 | tspan9a |
| 2538498 | CvL | LG19 | 1.573263e-07 | 0.454344073 | -62.66667 | SDK2 |
| 1233468 | CvL | LG13 | 8.333341e-07 | 0.504339931 | 53.57143 | LSAMP |
| 2562745 | CvL | LG19 | 1.251644e-06 | 0.504339931 | 50.00000 | cep131 |
| 2633973 | CvL | LG19 | 1.229688e-06 | 0.504339931 | -72.30769 | atad1b |
| 2649322 | CvL | LG2 | 9.436707e-07 | 0.504339931 | 41.37931 | zgc:152904 |
| 2651466 | CvL | LG2 | 1.316960e-06 | 0.504339931 | -62.37037 | zgc:152904 |
| 2658131 | CvL | LG2 | 1.298464e-06 | 0.504339931 | 71.70868 | trim25l |
| 2977079 | CvL | LG2 | 4.418371e-07 | 0.504339931 | -40.00000 | col5a2a |
| 3470539 | CvL | LG22 | 1.287505e-06 | 0.504339931 | -35.48387 | maco1b |
| LightComp | location | pvalue | qvalue | meth.diff | gene_name | |
|---|---|---|---|---|---|---|
| 2388420 | GvL | LG17 | 5.842523e-08 | 0.08732888 | 59.65157 | LRP8 |
| 1171364 | GvL | LG12 | 1.880141e-07 | 0.19257549 | 48.00000 | TMEM38B |
| 4770087 | GvL | LG5 | 1.999029e-07 | 0.19257549 | -53.47826 | ip6k1 |
| 5928120 | GvL | LG9 | 3.187294e-07 | 0.27401711 | -36.17021 | antxr2a |
| 4565343 | GvL | LG4 | 3.796739e-07 | 0.28358728 | 44.44444 | TNS3 |
| 2836779 | GvL | LG19 | 4.744448e-07 | 0.32026502 | -49.04880 | kcnh4b |
| 2667805 | GvL | LG18 | 5.288252e-07 | 0.33533869 | -58.38207 | NA |
| 4097377 | GvL | LG23 | 7.356941e-07 | 0.35812320 | -49.89418 | anks1b |
| 6014511 | GvL | LG9 | 7.530081e-07 | 0.35812320 | -49.00585 | EPX |
| 3361805 | GvL | LG2 | 8.053226e-07 | 0.36635111 | -49.59083 | ugt1a1 |
| LightComp | location | qvalue | meth.diff | gene_name | |
|---|---|---|---|---|---|
| 1195612 | CvG | LG4 | 2.819262e-08 | 69.49153 | nasp |
| 1195618 | CvG | LG4 | 5.855272e-08 | 71.81818 | nasp |
| 1195545 | CvG | LG4 | 5.980539e-08 | 73.61963 | nasp |
| 1195547 | CvG | LG4 | 4.924975e-07 | 67.64706 | nasp |
| 1195622 | CvG | LG4 | 1.046036e-06 | 69.15584 | nasp |
| 1195626 | CvG | LG4 | 1.046036e-06 | 65.26210 | nasp |
| 1195544 | CvG | LG4 | 1.616029e-06 | 62.43094 | nasp |
| 1195543 | CvG | LG4 | 1.940128e-06 | 59.77654 | nasp |
| 1195630 | CvG | LG4 | 2.994685e-06 | 65.58559 | nasp |
| 1195541 | CvG | LG4 | 7.586140e-06 | 60.12658 | nasp |
| LightComp | location | qvalue | meth.diff | gene_name | |
|---|---|---|---|---|---|
| 804720 | CvL | LG2 | 0.5043399 | -62.37037 | zgc:152904 |
| 910884 | CvL | LG20 | 0.5043399 | 56.98925 | uncharacterised |
| 1371208 | CvL | LG6 | 0.5043399 | 53.33333 | kti12 |
| 818069 | CvL | LG2 | 0.5646001 | 56.09244 | uncharacterised |
| 1568297 | CvL | LG9 | 0.5646001 | -44.82759 | adora2aa |
| 543482 | CvL | LG15 | 0.5846745 | -45.45455 | ATE1 |
| 543483 | CvL | LG15 | 0.5846745 | -45.45455 | ATE1 |
| 705655 | CvL | LG18 | 0.5901297 | 43.33333 | uncharacterised |
| 1448486 | CvL | LG7 | 0.5901297 | 45.00000 | gid8b |
| 1448487 | CvL | LG7 | 0.5901297 | 45.00000 | gid8b |
| LightComp | location | qvalue | meth.diff | gene_name | |
|---|---|---|---|---|---|
| 1338222 | GvL | LG4 | 1.121417e-11 | -69.27181 | nasp |
| 1338320 | GvL | LG4 | 4.274991e-09 | -68.91892 | nasp |
| 1338321 | GvL | LG4 | 4.274991e-09 | -68.91892 | nasp |
| 1338314 | GvL | LG4 | 6.124197e-09 | -69.78610 | nasp |
| 1338315 | GvL | LG4 | 6.124197e-09 | -69.78610 | nasp |
| 1338318 | GvL | LG4 | 6.124197e-09 | -68.38710 | nasp |
| 1338319 | GvL | LG4 | 6.124197e-09 | -68.38710 | nasp |
| 1338310 | GvL | LG4 | 9.637436e-09 | -71.92571 | nasp |
| 1338311 | GvL | LG4 | 9.637436e-09 | -71.92571 | nasp |
| 1338223 | GvL | LG4 | 2.597112e-05 | -56.01915 | nasp |
Both the clear versus green (table 9) and green versus lilac (table 11) comparisons contained the same ten differentiated CpG sites, which were all annotated to the same nasp gene. There were no significantly differentiated CpG sites from the clear versus lilac (table 10) comparison which could be annotated to promoter regions.
3.4.2.2 Tile level
| LightComp | MethDirection | Annotation | Tiles |
|---|---|---|---|
| CvG | up | N/A | 16999 |
| CvG | down | N/A | 39913 |
| CvG | total | N/A | 56912 |
| CvL | up | N/A | 19497 |
| CvL | down | N/A | 30189 |
| CvL | total | N/A | 49686 |
| GvL | up | N/A | 31399 |
| GvL | down | N/A | 20391 |
| GvL | total | N/A | 51790 |
| CvG | up | gene | 9745 |
| CvG | down | gene | 23903 |
| CvG | total | gene | 33648 |
| CvL | up | gene | 11337 |
| CvL | down | gene | 17795 |
| CvL | total | gene | 29132 |
| GvL | up | gene | 18666 |
| GvL | down | gene | 11776 |
| GvL | total | gene | 30442 |
| CvG | up | promoter | 3037 |
| CvG | down | promoter | 5836 |
| CvG | total | promoter | 8873 |
| CvL | up | promoter | 3285 |
| CvL | down | promoter | 4499 |
| CvL | total | promoter | 7784 |
| GvL | up | promoter | 4718 |
| GvL | down | promoter | 3417 |
| GvL | total | promoter | 8135 |
A larger number of differentially methylated tiles were identified (table 12) when compared to the dmrseq identified regions and the methylkit identified CpG sites.
| LightComp | location | pvalue | qvalue | meth.diff | |
|---|---|---|---|---|---|
| 452727 | CvG | LG4 | 9.714622e-131 | 4.885614e-125 | 19.239478 |
| 452726 | CvG | LG4 | 1.196917e-89 | 3.009727e-84 | 19.897694 |
| 277432 | CvG | LG19 | 1.774652e-81 | 2.974987e-76 | -22.272263 |
| 17240 | CvG | KK215608.1 | 1.425147e-63 | 1.791814e-58 | 10.634437 |
| 139886 | CvG | LG13 | 3.721408e-59 | 3.743092e-54 | 20.536203 |
| 373358 | CvG | LG21 | 6.434827e-53 | 5.393601e-48 | 17.569509 |
| 29769 | CvG | LG1 | 3.550053e-47 | 2.550528e-42 | 14.606176 |
| 361837 | CvG | LG21 | 2.372031e-46 | 1.491158e-41 | 14.585360 |
| 37257 | CvG | LG1 | 1.654721e-42 | 9.246461e-38 | -6.231157 |
| 6554 | CvG | KK215291.1 | 1.040687e-37 | 5.233756e-33 | 16.920822 |
| LightComp | location | pvalue | qvalue | meth.diff | |
|---|---|---|---|---|---|
| 204228 | CvL | LG16 | 3.213330e-96 | 1.635845e-90 | -25.98584 |
| 361025 | CvL | LG21 | 8.837088e-72 | 2.249397e-66 | 19.69921 |
| 276792 | CvL | LG19 | 1.236241e-66 | 2.097822e-61 | -20.54554 |
| 284545 | CvL | LG19 | 5.976181e-65 | 7.605902e-60 | 22.88567 |
| 602637 | CvL | LG9 | 3.595176e-58 | 3.660472e-53 | 20.83910 |
| 372516 | CvL | LG21 | 1.515368e-52 | 1.285742e-47 | 18.42160 |
| 317691 | CvL | LG2 | 4.065070e-48 | 2.956357e-43 | -20.26683 |
| 14178 | CvL | KK215350.1 | 1.997522e-45 | 1.271126e-40 | 24.99745 |
| 1189 | CvL | KK215283.1 | 2.043225e-44 | 1.155741e-39 | 13.08783 |
| 547708 | CvL | LG7 | 8.559718e-41 | 4.357590e-36 | 23.29152 |
| LightComp | location | pvalue | qvalue | meth.diff | |
|---|---|---|---|---|---|
| 464144 | GvL | LG4 | 7.503577e-141 | 3.921253e-135 | -19.016257 |
| 464143 | GvL | LG4 | 8.017760e-104 | 2.094979e-98 | -19.309795 |
| 1205 | GvL | KK215283.1 | 1.012781e-55 | 1.764212e-50 | 13.265035 |
| 210188 | GvL | LG16 | 1.433189e-54 | 1.872407e-49 | -17.403727 |
| 143822 | GvL | LG13 | 1.900156e-51 | 1.985985e-46 | -17.695603 |
| 370715 | GvL | LG21 | 5.180641e-40 | 4.512205e-35 | -12.608880 |
| 283555 | GvL | LG18 | 2.190222e-39 | 1.635109e-34 | 14.869760 |
| 161199 | GvL | LG14 | 2.644311e-35 | 1.727345e-30 | -17.151052 |
| 242088 | GvL | LG17 | 8.543377e-35 | 4.960707e-30 | 19.287516 |
| 38534 | GvL | LG1 | 2.744822e-33 | 1.434401e-28 | 4.758557 |
| LightComp | location | qvalue | qvalue | meth.diff | gene_name | |
|---|---|---|---|---|---|---|
| 157446 | CvG | LG19 | 1.774652e-81 | 2.974987e-76 | -22.272263 | SHANK1 |
| 76291 | CvG | LG13 | 3.721408e-59 | 3.743092e-54 | 20.536203 | NA |
| 14405 | CvG | LG1 | 3.550053e-47 | 2.550528e-42 | 14.606176 | slx4 |
| 203997 | CvG | LG21 | 2.372031e-46 | 1.491158e-41 | 14.585360 | hivep2a |
| 18677 | CvG | LG1 | 1.654721e-42 | 9.246461e-38 | -6.231157 | NA |
| 156721 | CvG | LG18 | 1.092368e-36 | 4.994240e-32 | -15.394290 | aimp1b |
| 156722 | CvG | LG18 | 1.092368e-36 | 4.994240e-32 | -15.394290 | NA |
| 161865 | CvG | LG19 | 1.033326e-35 | 4.330611e-31 | 16.787633 | QRFPR |
| 223201 | CvG | LG22 | 7.000381e-34 | 2.514704e-29 | -31.913947 | NA |
| 345235 | CvG | LG9 | 8.468147e-34 | 2.839163e-29 | 14.478395 | homer1b |
| LightComp | location | qvalue | qvalue | meth.diff | gene_name | |
|---|---|---|---|---|---|---|
| 113524 | CvL | LG16 | 3.213330e-96 | 1.635845e-90 | -25.98584 | NA |
| 203638 | CvL | LG21 | 8.837088e-72 | 2.249397e-66 | 19.69921 | hivep2a |
| 157168 | CvL | LG19 | 1.236241e-66 | 2.097822e-61 | -20.54554 | SHANK1 |
| 161585 | CvL | LG19 | 5.976181e-65 | 7.605902e-60 | 22.88567 | QRFPR |
| 344625 | CvL | LG9 | 3.595176e-58 | 3.660472e-53 | 20.83910 | homer1b |
| 180121 | CvL | LG2 | 4.065070e-48 | 2.956357e-43 | -20.26683 | ephx2 |
| 311551 | CvL | LG7 | 8.559718e-41 | 4.357590e-36 | 23.29152 | uts2a |
| 54558 | CvL | LG11 | 1.078697e-40 | 4.992221e-36 | -13.62358 | ncdn |
| 203346 | CvL | LG21 | 5.735034e-40 | 2.432998e-35 | -13.78305 | crnkl1 |
| 203347 | CvL | LG21 | 5.735034e-40 | 2.432998e-35 | -13.78305 | NA |
| LightComp | location | qvalue | qvalue | meth.diff | gene_name | |
|---|---|---|---|---|---|---|
| 116121 | GvL | LG16 | 1.433189e-54 | 1.872407e-49 | -17.403727 | NA |
| 77967 | GvL | LG13 | 1.900156e-51 | 1.985985e-46 | -17.695603 | NA |
| 207930 | GvL | LG21 | 5.180641e-40 | 4.512205e-35 | -12.608880 | crnkl1 |
| 207931 | GvL | LG21 | 5.180641e-40 | 4.512205e-35 | -12.608880 | NA |
| 160079 | GvL | LG18 | 2.190222e-39 | 1.635109e-34 | 14.869760 | aimp1b |
| 160080 | GvL | LG18 | 2.190222e-39 | 1.635109e-34 | 14.869760 | NA |
| 88277 | GvL | LG14 | 2.644311e-35 | 1.727345e-30 | -17.151052 | NA |
| 88278 | GvL | LG14 | 2.644311e-35 | 1.727345e-30 | -17.151052 | zgc:112437 |
| 135448 | GvL | LG17 | 8.543377e-35 | 4.960707e-30 | 19.287516 | NA |
| 19131 | GvL | LG1 | 2.744822e-33 | 1.434401e-28 | 4.758557 | NA |
| LightComp | location | qvalue | meth.diff | gene_name | |
|---|---|---|---|---|---|
| 86983 | CvG | LG4 | 4.885614e-125 | 19.239478 | gpc5b |
| 86984 | CvG | LG4 | 4.885614e-125 | 19.239478 | nasp |
| 86981 | CvG | LG4 | 3.009727e-84 | 19.897694 | gpc5b |
| 86982 | CvG | LG4 | 3.009727e-84 | 19.897694 | nasp |
| 6509 | CvG | LG1 | 2.550528e-42 | 14.606176 | slx4 |
| 8294 | CvG | LG1 | 9.246461e-38 | -6.231157 | uncharacterised |
| 8295 | CvG | LG1 | 9.246461e-38 | -6.231157 | lgi2b |
| 77529 | CvG | LG22 | 2.514704e-29 | -31.913947 | uncharacterised |
| 92712 | CvG | LG5 | 1.113321e-24 | 13.827373 | asb14a |
| 73774 | CvG | LG21 | 1.148219e-24 | 11.441065 | entpd5b |
| LightComp | location | qvalue | meth.diff | gene_name | |
|---|---|---|---|---|---|
| 63161 | CvL | LG2 | 2.956357e-43 | -20.26683 | zgc:194275 |
| 106383 | CvL | LG7 | 4.357590e-36 | 23.29152 | uts2a |
| 20949 | CvL | LG11 | 4.992221e-36 | -13.62358 | tfap2e |
| 70661 | CvL | LG21 | 2.432998e-35 | -13.78305 | uncharacterised |
| 31311 | CvL | LG14 | 3.402312e-35 | -21.04322 | zgc:112437 |
| 20618 | CvL | LG11 | 4.588411e-27 | 13.36592 | fabp10b |
| 36545 | CvL | LG15 | 3.195656e-25 | -11.29762 | grid1a |
| 74546 | CvL | LG21 | 6.018677e-25 | -19.15004 | gabrr2b |
| 70641 | CvL | LG21 | 4.121079e-24 | -14.58253 | uncharacterised |
| 70642 | CvL | LG21 | 4.121079e-24 | -14.58253 | crnkl1 |
| LightComp | location | qvalue | meth.diff | gene_name | |
|---|---|---|---|---|---|
| 88849 | GvL | LG4 | 3.921253e-135 | -19.016257 | gpc5b |
| 88850 | GvL | LG4 | 3.921253e-135 | -19.016257 | nasp |
| 88847 | GvL | LG4 | 2.094979e-98 | -19.309795 | gpc5b |
| 88848 | GvL | LG4 | 2.094979e-98 | -19.309795 | nasp |
| 72353 | GvL | LG21 | 4.512205e-35 | -12.608880 | uncharacterised |
| 32069 | GvL | LG14 | 1.727345e-30 | -17.151052 | zgc:112437 |
| 47593 | GvL | LG17 | 4.960707e-30 | 19.287516 | uncharacterised |
| 8532 | GvL | LG1 | 1.434401e-28 | 4.758557 | uncharacterised |
| 8533 | GvL | LG1 | 1.434401e-28 | 4.758557 | lgi2b |
| 94665 | GvL | LG5 | 2.518285e-27 | -13.468644 | asb14a |
A large number of tiles associated with extremely low q-values (table 13) were identified. A large proportion of these were annotated both within genes (table 14) and within the promoter regions (table 15) of genes. The function of these genes associated with these extremely low q-values were investigated.
The extremely differentiated tiles are mostly evenly spread across the entirety of the genomes (figure 17). When observing the clear versus green RCircos plot (figure 16.A), it appears as though a large number of significantly differentiated tiles are located across chromosome 16. However, only 5 differentiated tiles out of the 75 chosen to be displayed in this plot are present on chromosome 16. This problem was therefore likely caused by a bug in the RCircos package.
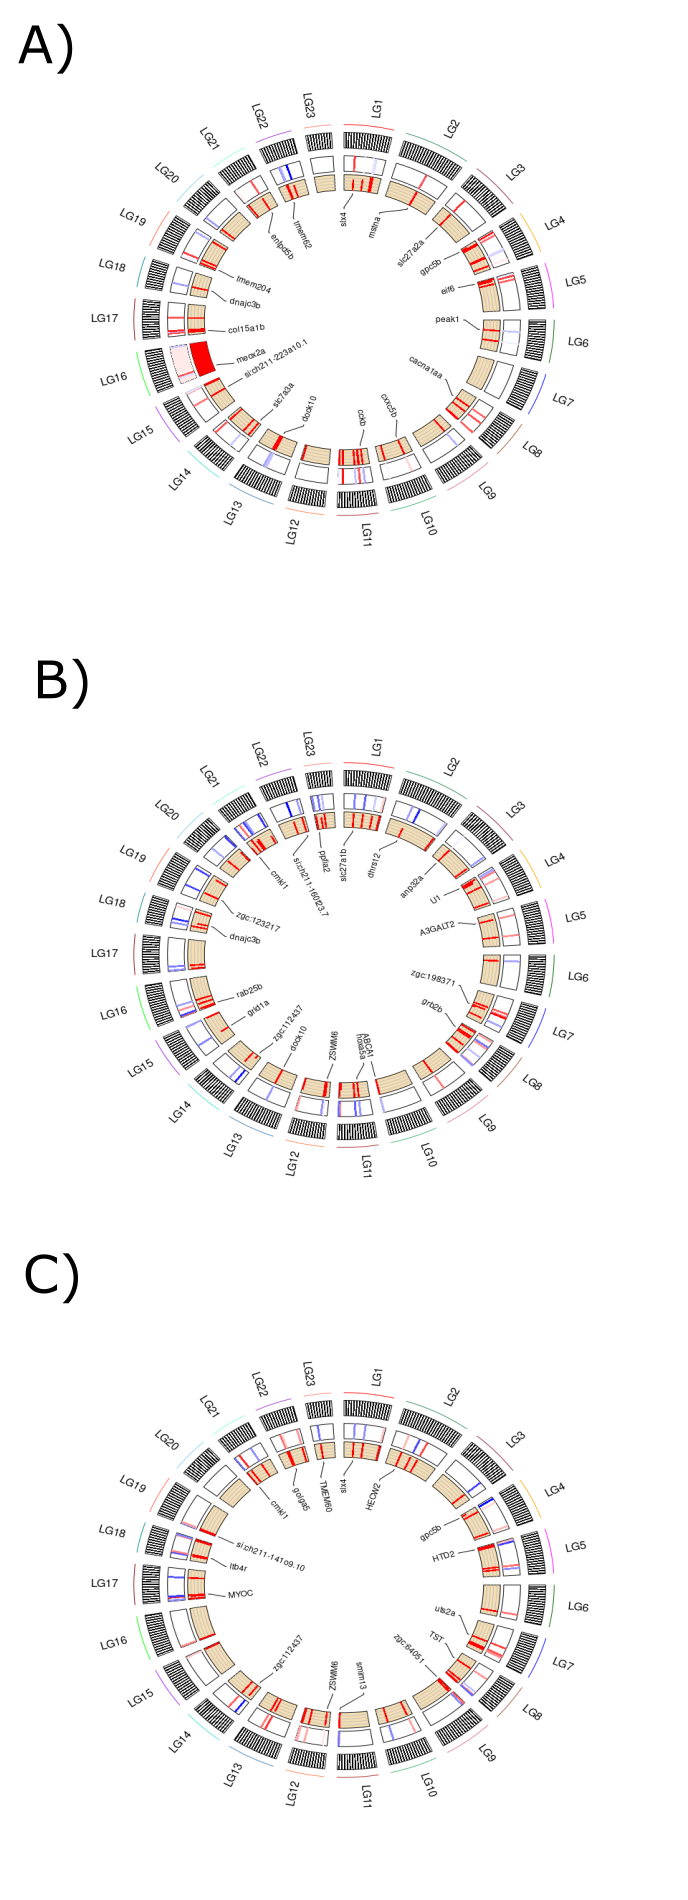
Figure 3.14: Contains three RCircos plots which show the location and level of differentiation of the 75 most differentially methylated tiles. (A) RCircos plot generated from clear versus green comparison. (B) RCircos plot generated from clear versus lilac comparison. (C) RCircos plot generated from green versus lilac comparison.
There exists a number of genes which contain many significantly differentiated tiles in their promoter regions (figure 18). Due to the presence of this differential methylation, these genes are likely to have their expression levels altered. Therefore, to explore if these genes may confer a sexually selected advantage their functions were investigated further.
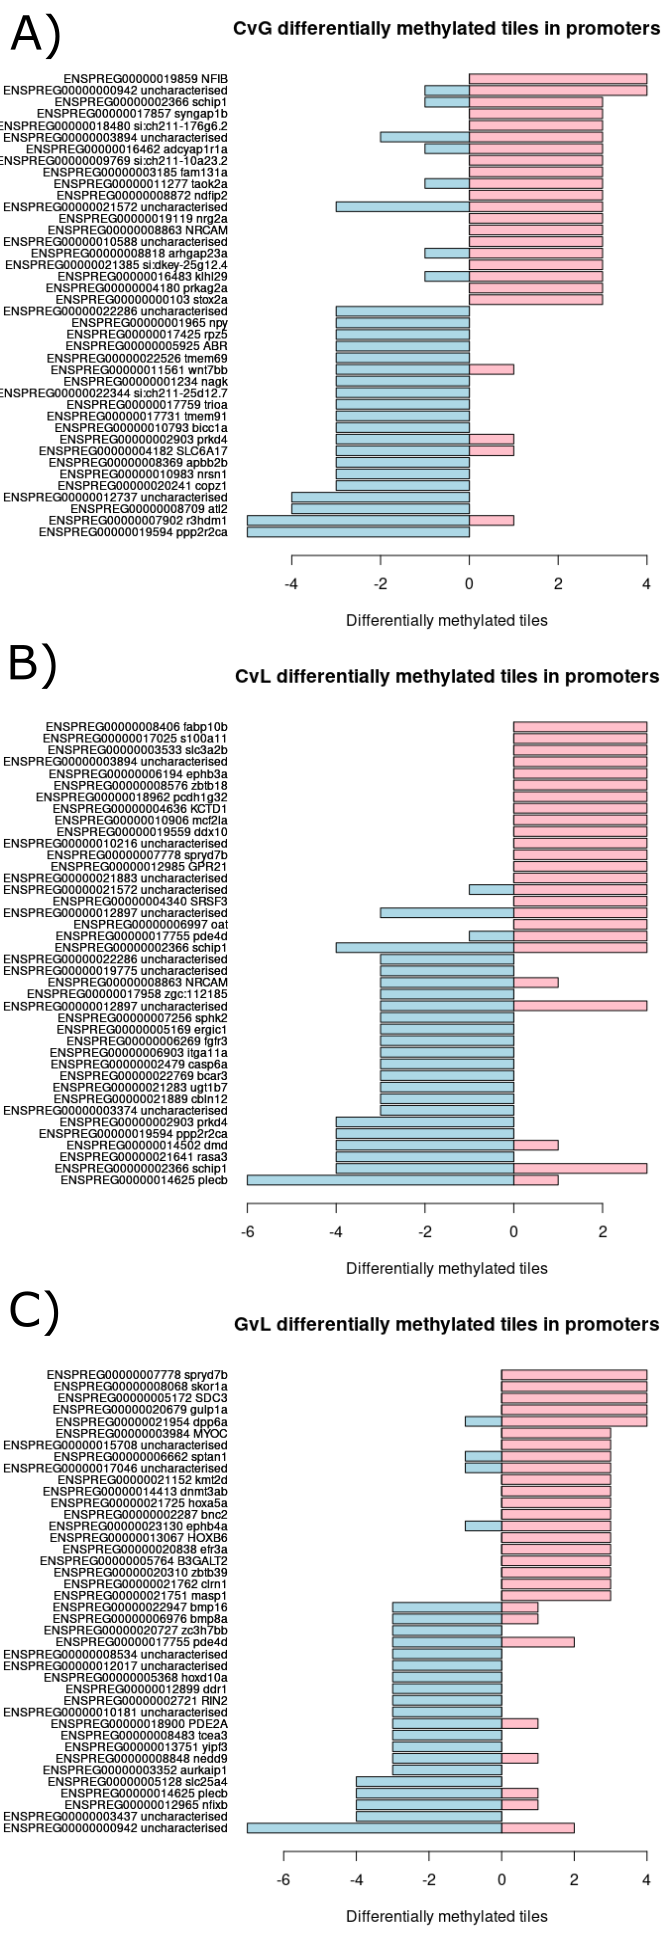
Figure 3.15: Contains three bar charts which each display the twenty genes with the most differentially methylated tiles annotated to their promoter region which are in the negative direction and the twenty genes with the most differentially methylated tiles annotated to their promoter region which are in the positive direction from each light condition comparison. (A) Bar chart created using clear versus green comparison. (B) Bar chart created using clear versus lilac comparison. (C) Bar chart created using green versus lilac comparison.
3.5 Enrichment analysis
If the changes in light conditions resulted in methylation derived alterations to gene expression we expect to find biological pathways/functions significantly enriched that can be linked to the experimental conditions. Biological pathways that have been significantly or reasonably close to significantly enriched that are linkable to the experimental conditions are notable results. Notable results of this kind will be highlighted in this results section and explored further in the discussion.
3.5.1 mitch
| LightComp | pathway/function | pANOVA | p.adjustANOVA |
|---|---|---|---|
| CvG | GO:0051087 chaperone binding | 0.00017 | 0.17158 |
| CvG | GO:0005833 hemoglobin complex | 0.00038 | 0.18963 |
| CvG | GO:0006289 nucleotide-excision repair | 0.00071 | 0.20944 |
| CvG | GO:0030509 BMP signaling pathway | 0.00085 | 0.20944 |
| CvG | GO:0004879 nuclear receptor activity | 0.00168 | 0.33188 |
| CvG | GO:0001947 heart looping | 0.00402 | 0.57700 |
| CvG | GO:0005525 GTP binding | 0.00414 | 0.57700 |
| CvG | GO:0043231 intracellular membrane-bounded organelle | 0.00497 | 0.57700 |
| CvG | GO:0043065 positive regulation of apoptotic process | 0.00525 | 0.57700 |
| CvG | GO:0008033 tRNA processing | 0.00615 | 0.59074 |
| CvL | GO:0033179 proton-transporting V-type ATPase, V0 domain | 0.00090 | 0.88100 |
| CvL | GO:0016042 lipid catabolic process | 0.00234 | 0.88100 |
| CvL | GO:0007218 neuropeptide signaling pathway | 0.00268 | 0.88100 |
| CvL | GO:0005184 neuropeptide hormone activity | 0.00537 | 0.91821 |
| CvL | GO:0005901 caveola | 0.00583 | 0.91821 |
| CvL | GO:0030516 regulation of axon extension | 0.00650 | 0.91821 |
| CvL | GO:0006417 regulation of translation | 0.00651 | 0.91821 |
| CvL | GO:0060027 convergent extension involved in gastrulation | 0.00904 | 0.95684 |
| CvL | GO:0000902 cell morphogenesis | 0.00954 | 0.95684 |
| CvL | GO:0043005 neuron projection | 0.01354 | 0.95684 |
| GvL | GO:0050661 NADP binding | 0.00072 | 0.54754 |
| GvL | GO:0021522 spinal cord motor neuron differentiation | 0.00143 | 0.54754 |
| GvL | GO:0002224 toll-like receptor signaling pathway | 0.00245 | 0.54754 |
| GvL | GO:0005096 GTPase activator activity | 0.00249 | 0.54754 |
| GvL | GO:0007420 brain development | 0.00277 | 0.54754 |
| GvL | GO:0032580 Golgi cisterna membrane | 0.00519 | 0.79384 |
| GvL | GO:0042742 defense response to bacterium | 0.00652 | 0.79384 |
| GvL | GO:0016712 oxidoreductase activity, acting on paired donors, with incorporation or reduction of molecular oxygen, reduced flavin or flavoprotein as one donor, and incorporation of one atom of oxygen | 0.00655 | 0.79384 |
| GvL | GO:0006281 DNA repair | 0.00803 | 0.79384 |
| GvL | GO:0007264 small GTPase mediated signal transduction | 0.00830 | 0.79384 |
The mitch class sorting enrichment analysis (table 16) yielded no significantly enriched biological pathways for any of the three light group comparisons. The closest to a significant result was the biological pathway chaperone binding which was associated with an adjusted p-value of 0.172 when comparing clear versus green light conditions. GTP binding was associated with a q-value of 0.577 and was seventh most enriched pathway (when comparing p-values associated with pathways) out of a list of 1441 pathways in the clear versus green analysis. The clear versus lilac analysis yielded the least enriched results. Brain development was associated with a q-value of 0.548 and was the fifth most enriched pathway in the green versus lilac analysis. GTPase activator activity was also associated with a q-value of 0.548 and was the fourth most enriched pathway in the green versus lilac analysis.
3.5.2 Cluster profiler
The most interesting results were extracted from the cluster profiler over representation analysis and were used to create two tables. One displayed numerous significantly enriched biological pathways (table 17) and the other displayed pathways which were not significantly enriched but still interesting results (table 18).
3.5.2.1 Significantly enriched
| LightComp | MethDirection | Qvalselection | Pathway | Qvalue |
|---|---|---|---|---|
| CvG | all | <0.001 | Regulation of GTPase | 0.0491 |
| CvL | up | <0.5 | nucleus | 0.0446 |
| GvL | up | <0.5 | multicellular organism development | 0.0039 |
| GvL | all | <0.5 | multicellular organism development | 0.0009 |
| GvL | all | <0.5 | DNA-binding transcription factor activity, RNA polymerase II-specific | 0.0085 |
| GvL | all | <0.001 | fatty acid transmembrane transporter activity | 0.0043 |
| GvL | all | <0.001 | long-chain fatty acid metabolic process | 0.0043 |
| GvL | all | <0.001 | long-chain fatty acid-CoA ligase activity | 0.0043 |
| GvL | all | <0.001 | fatty acid transport | 0.0043 |
| GvL | all | <0.001 | very long-chain fatty acid-CoA ligase activity | 0.0043 |
| GvL | all | <0.001 | bile acid biosynthetic process | 0.0404 |
The biological pathway, regulation of GTPase, was significantly enriched in the clear versus green analysis in which all tiles associated with a q-value of <0.001 were selected. This biological pathway was associated with a q-value of 0.049. The clear versus lilac analysis in which only those tiles which were methylated in the positive direction and associated with a q-value of <0.05 were selected yielded one significantly enriched pathway. The pathway nucleus was associated with a q-value of 0.046.
The green versus lilac analysis in which only those tiles which were methylated in the positive direction and associated with a q-value of <0.05 were selected yielded one significantly enriched pathway. The pathway multicellular organism development was associated with a q-value of 0.0039. This same light condition analysis in which all tiles associated with a q-value of <0.05 were selected yielded two significant results. multicellular organism development was associated with a q-value of 0.0039 and DNA-binding transcription factor activity, RNA polymerase II-specific was associated with a q-value of 0.0085.
The green versus lilac analysis in which all those tiles which were associated with a q-value of 0.001 yielded six significantly enriched pathways. fatty acid transmembrane transporter activity, long-chain fatty acid metabolic process, long-chain fatty acid-CoA ligase activity, fatty acid transport and very long-chain fatty acid-CoA ligase activity were all associated with a q-value of 0.0043. bile acid biosynthetic process was associated with a q-value of 0.0404.
3.5.2.2 Other notable results
## [1] "CvG" "CvG" "CvL" "CvL" "GvL" "GvL"| LightComp | MethDirection | Qvalselection | Pathway | Pvalue | Qvalue | No.Pathway |
|---|---|---|---|---|---|---|
| CvG | up | <0.5 | Regulation of cell migration | 0.0039 | 0.7950 | 4 |
| CvG | up | <0.5 | Neural crest cell | 0.0059 | 0.7950 | 5 |
| CvL | up | <0.5 | Retina morphogenesis in camera-type eye | 0.0006 | 0.3619 | 2 |
| CvL | up | <0.001 | melanocyte differentiation | 0.0056 | 0.5707 | 2 |
| GvL | all | <0.5 | GTPase activator activity | 0.0001 | 0.0723 | 3 |
| GvL | down | <0.5 | embryonic camera-type eye development | 0.0129 | 0.5483 | 15 |
The clear versus green analysis in which only those tiles which were methylated in the positive direction associated with a q-value of <0.05 were selected had two notable results. Regulation of cell migration was associated with a q-value of 0.7950 and was the fourth most enriched pathway out of 1441 pathways in this analysis. Neural crest cell development was also associated with a q-value of 0.7950 and was the fifth most enriched pathway.
The clear versus lilac analysis in which only those tiles which were methylated in the positive direction and associated with a q-value of <0.05 were selected yielded one other notable result. Retina morphogenesis in camera-type eye was associated with a q-value of 0.3619 and was the second most enriched pathway in this analysis. The clear versus lilac analysis in which only those tiles which were methylated in the positive direction and associated with a q-value of <0.001 were selected yielded one other notable result. melanocyte differentiation was associated with a q-value of 0.5707 and was the second most enriched pathway.
The green versus lilac analysis in which all those tiles which were associated with a q-value of <0.05 were selected yielded one other notable result. GTPase activator activity was associated with a 0.0723 q-value and was the third most enriched pathway in this analysis. The green versus lilac analysis in which only those tiles which were methylated in the negative direction and were associated with a q-value of <0.05 were selected yielded one other notable result. embryonic camera-type eye development was associated with a q-value of 0.5483 and was the 15 most enriched pathway for this analysis.
3.6 Identified tiles
As charts were generated for a very large number of genes, not all could be presented in this thesis. Four genes which were either associated with extremely significant differentiated tiles and/or were were linked to the experimental conditions were selected. The rest of the plots can be obtained by running the script found at https://github.com/aaronsk7/guppy-methylation/blob/main/methylkitresultsanalysis.Rmd.
As the nasp gene was identified as significant at both the CpG site scale (table 9 and 11) and the tile scale (table 12 and 14) this is one gene which was investigated further (figure 19 and 20). The gpc5b gene was identified as significant at the tile scale and shared the same two tiles as the nasp gene in their promoter regions (figure 19 and 20). The first tile (figure 19.A) had ~10% greater mean methylation in the green1, green3 and foundation population than the other populations. The second tile (figure 20.A) had similar results to the first tile. The lilac3 population had a ~6% greater mean methylation in the second tile and the populations green2, lilac1, lilac2, clear1, clear2 and clear3 had a ~2% greater mean population in the second tile. Differences in methylation percentage distributions are observable for both tiles in the violin plot (figure 119.B and 20.B) and beeswarm plot that are in line with the mean methylation percentage results (figure 19.C and 20.C).
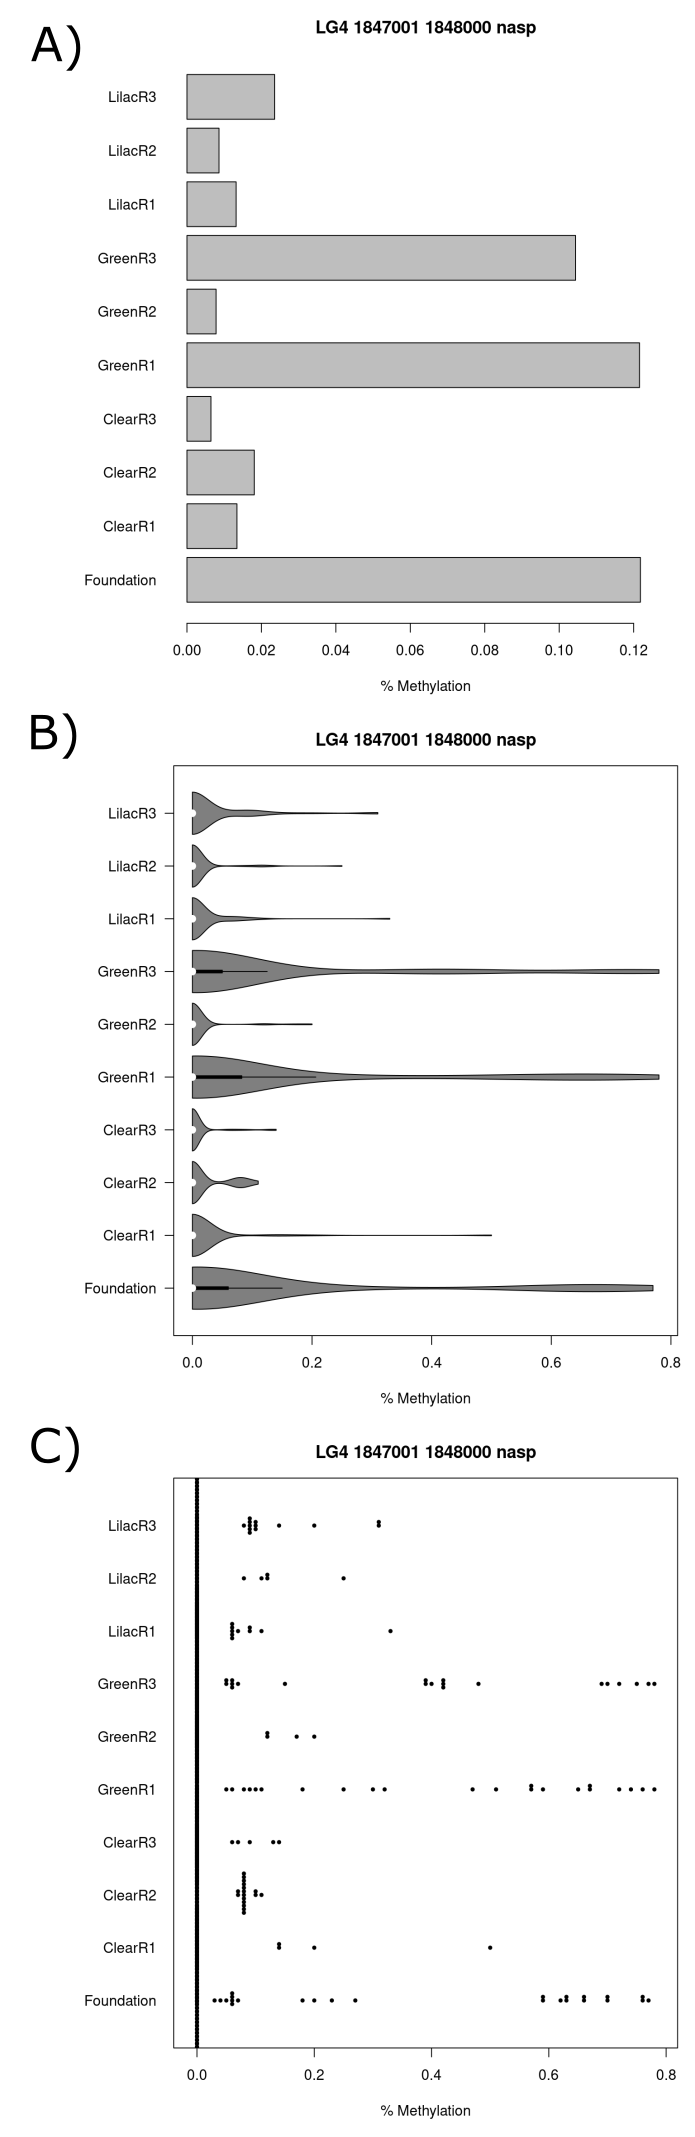
(#fig:figure 19)Series of charts displaying CpG methylation percentage for each sample at the tile which starts at the basepair 1847001 on chromosome 4 and is within the gpc5b and nasp gene promoter region. (A) Barchart (B) Violin plot (C) Beeswarm plot.
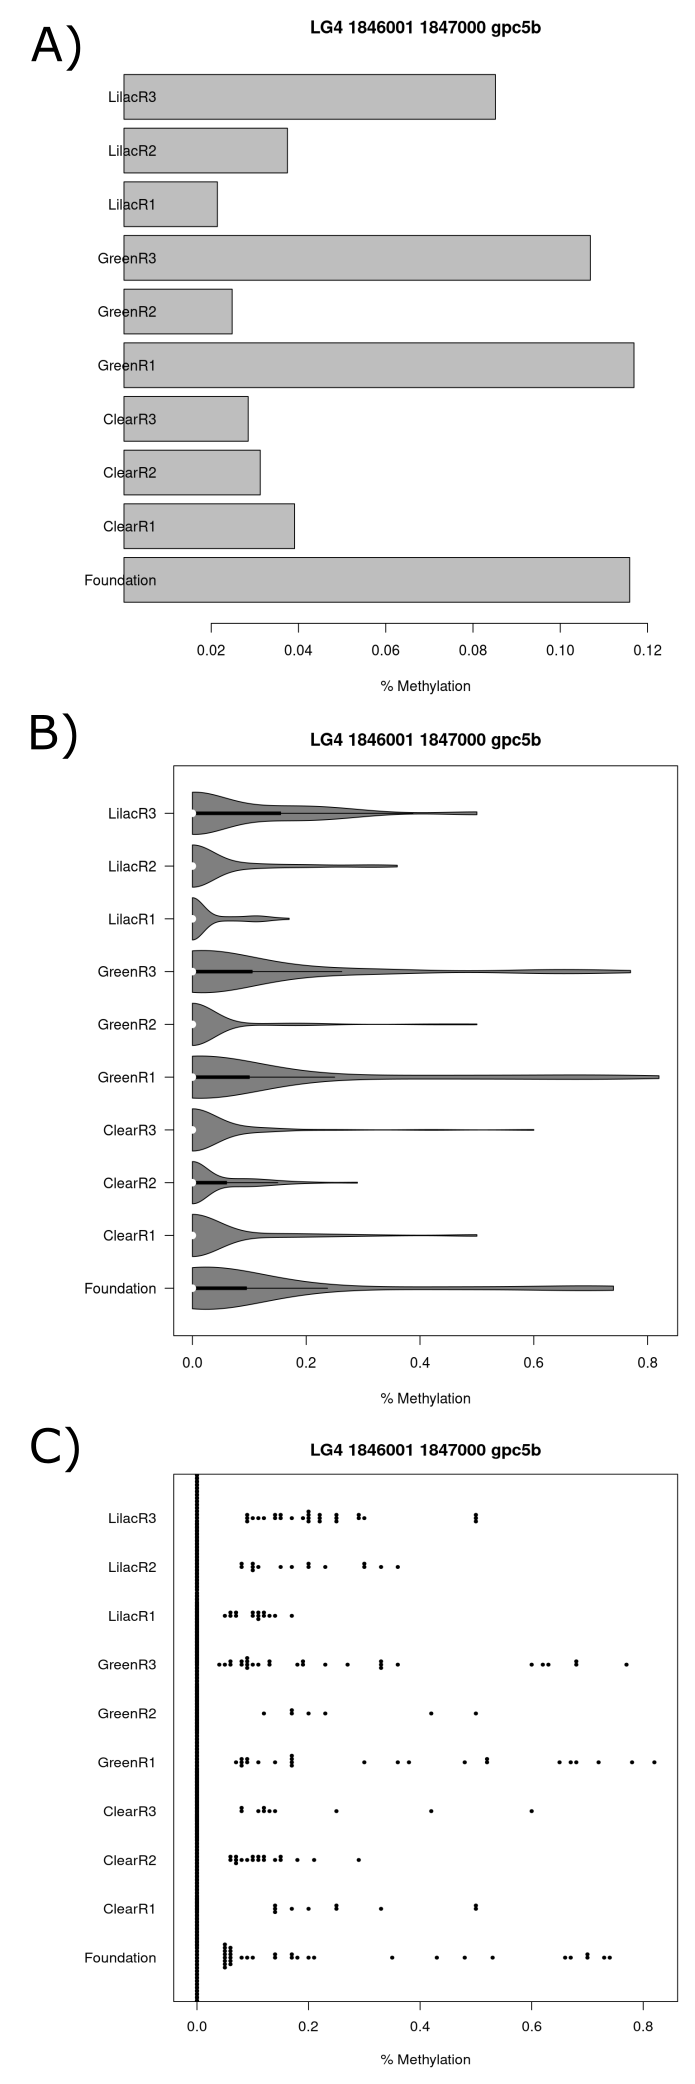
(#fig:figure 20)Series of charts displaying CpG methylation percentage for each sample at the tile which starts at the basepair 1846001 on chromosome 4 and is within the gpc5b and nasp gene promoter region. (A) Barchart (B) Violin plot (C) Beeswarm plot.
The most significant tile that could be annotated to the promoter region of a gene in the clear versus lilac comparison was annotated to the gene zgc:153964, the name of which has since been updated to ptk6b. This gene was investigated further. All three lilac populations and the clear1 population had a significantly reduced mean methylation percentage at <55% when compared to the others (figure 21.A). The clear2 and clear3 populations had the greatest mean methylation at >75%. Differences in methylation percentage distributions are observable in the violin plot (figure 21.B) and beeswarm plot that are in line with the mean methylation percentage results (figure 21.C).
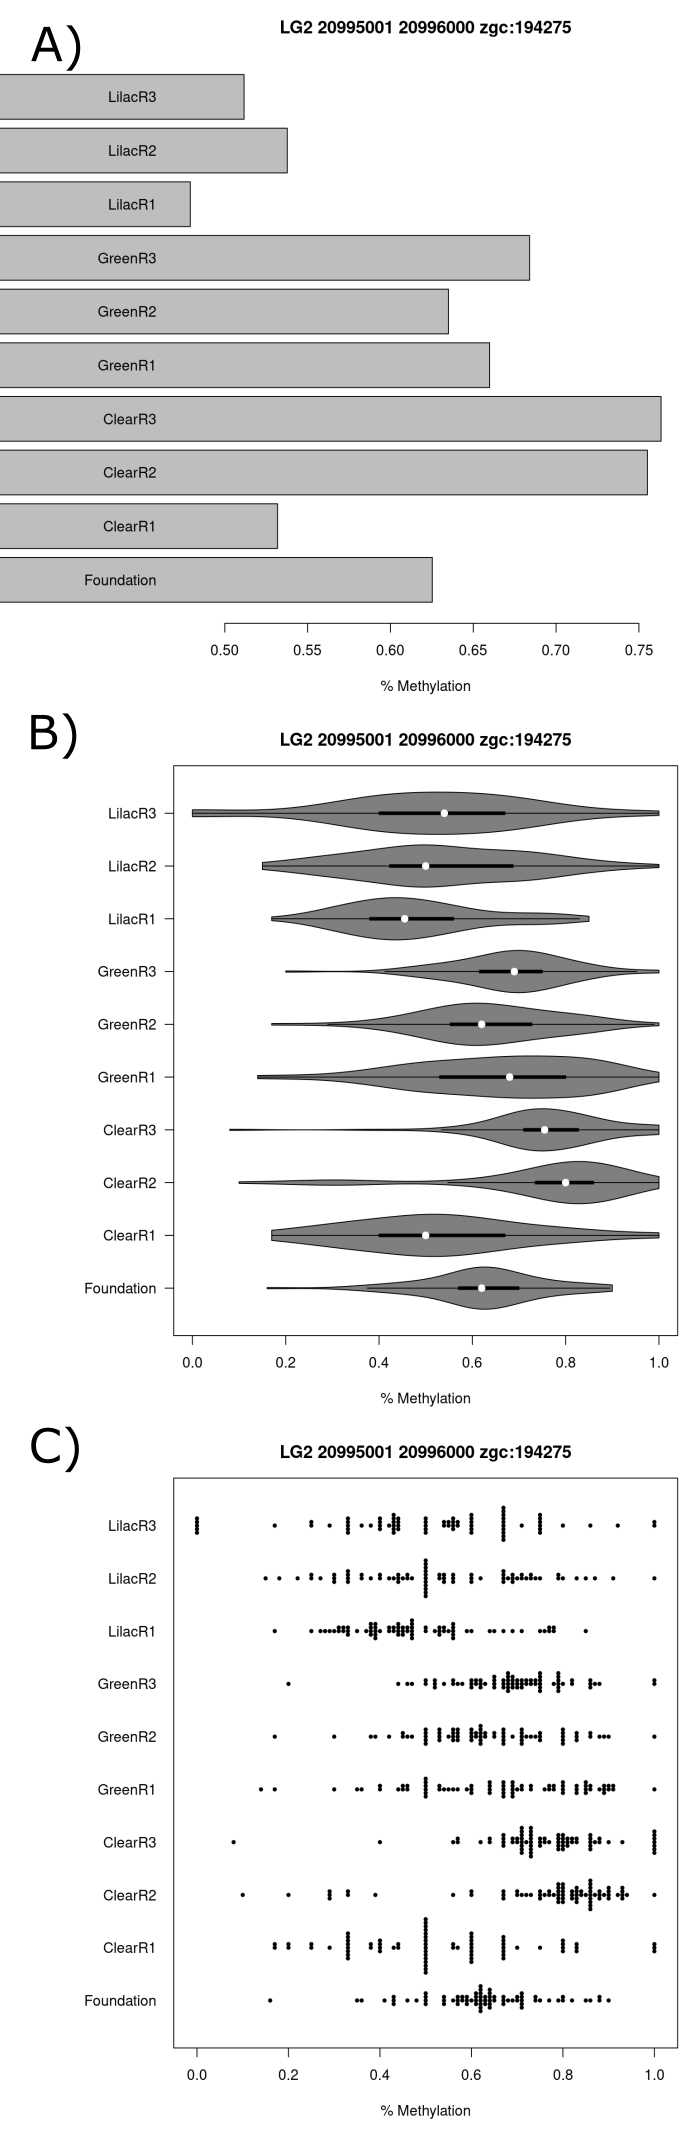
(#fig:figure 21)Series of charts displaying CpG methylation percentage for each sample at the tile which starts at the basepair 20995001 on chromosome 2 and is within the zgc:153964 or ptk6b gene promoter region. (A) Barchart (B) Violin plot (C) Beeswarm plot.
A tile which was significantly deferentially methylated and found in the promoter region of a gene, hmx1, which was linked the the biological pathway “retina morphogenesis in camera-type” was investigated further. The foundation population had a mean methylation percentage of <30% which was far greater than any other population (figure 22.A). Differences in methylation percentage distributions are observable in the violin plot (figure 22.B) and beeswarm plot that are in line with the mean methylation percentage results (figure 22.C).
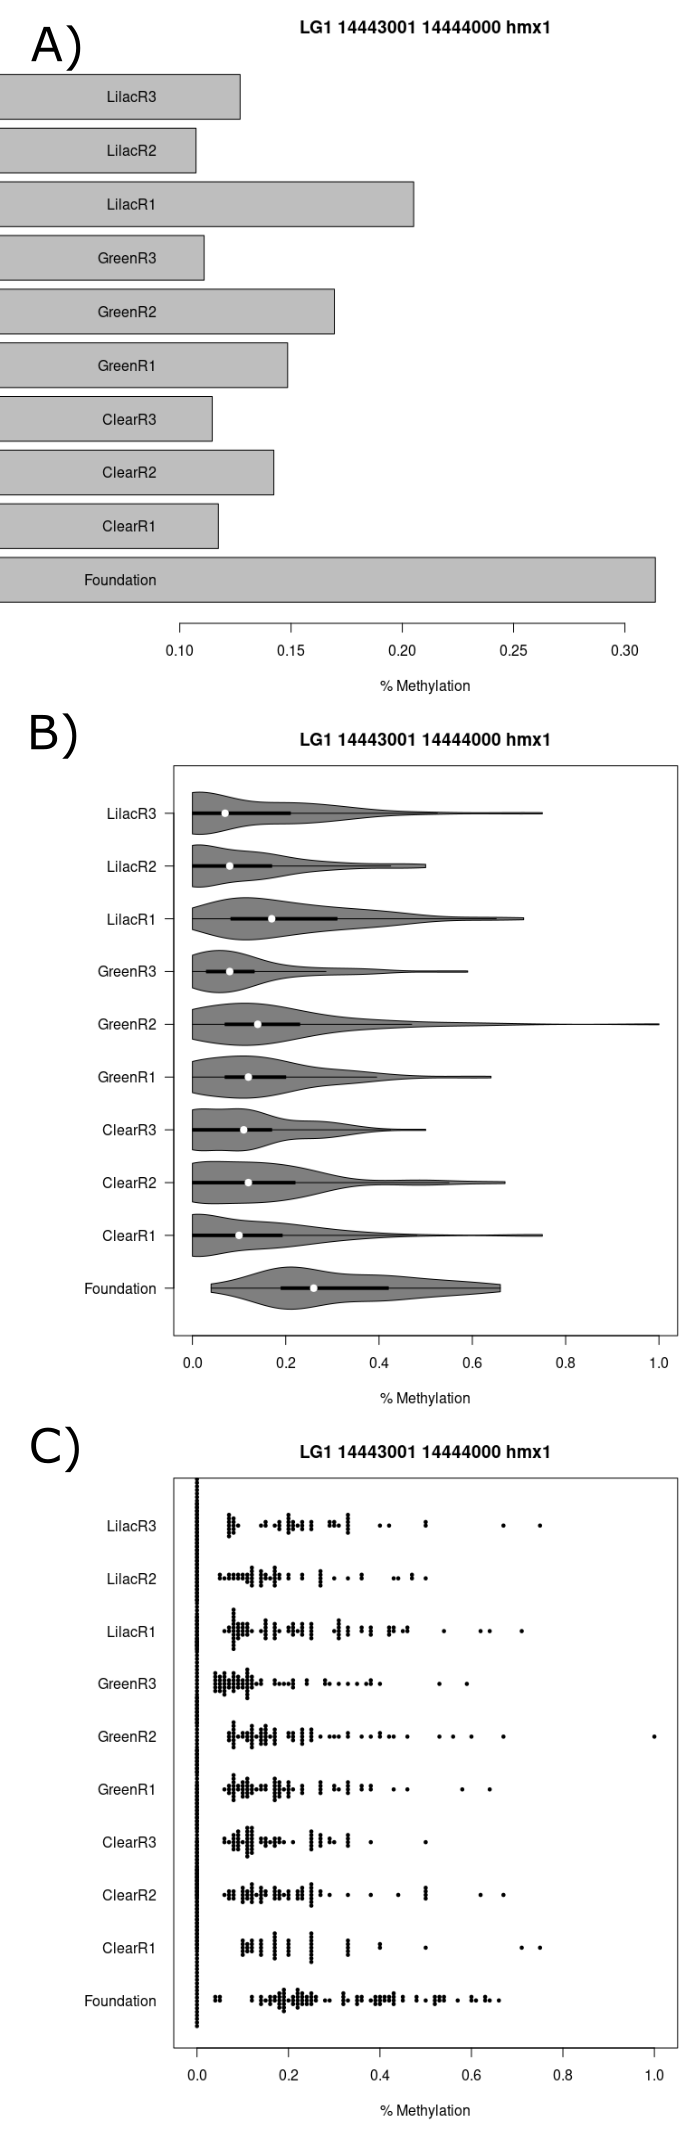
(#fig:figure 22)Series of charts displaying CpG methylation percentage for each sample at the tile which starts at the basepair 14443001 on chromosome 1 and is within the hmx1 gene promoter region. (A) Barchart (B) Violin plot (C) Beeswarm plot.